Regional Migration Analysis: 1-8 May 2015
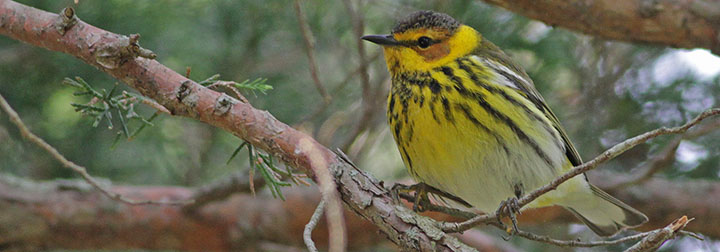
Cape May Warbler © Ian Davies
Continental Summary
[animation name=”1-8-may-2015-migration-analysis”]
Need a review of our definitions for regions, species on the move, and migration amounts? Please visit this link.
Quick Links to Regions
Upper Midwest and Northeast |
Gulf Coast and Southeast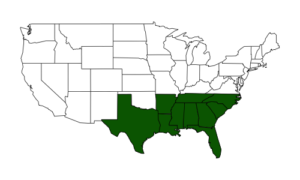 |
Great Plains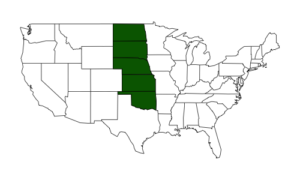 |
West |
Upper Midwest and Northeast
Top Movers
[expand title=”Increasing” tag=”h3″]
[table sort=”,desc” tablesorter=”true”]
Species,Increase from Last Week[attr style=”color:green”],% of Checklists Reporting
Baltimore Oriole,256%,40.5
Chestnut-sided Warbler,922%,12
Rose-breasted Grosbeak,213%,23
Magnolia Warbler,1467%,10.2
American Redstart,289%,16.5
Nashville Warbler,251%,14.9
Gray Catbird,166%,50.6
Black-throated Blue Warbler,298%,11.2
Least Flycatcher,597%,7.4
Cape May Warbler,950%,5.4
Veery,366%,8.1
Common Yellowthroat,168%,31.8
Indigo Bunting,233%,15.8
Swainson’s Thrush,657%,7.1
White-crowned Sparrow,206%,14.5
Ovenbird,121%,21.8
Blackburnian Warbler,271%,6.1
Blackpoll Warbler,1070%,4.4
Wood Thrush,115%,21.7
Great Crested Flycatcher,139%,20.2
Eastern Wood-Pewee,430%,5.2
Black-throated Green Warbler,117%,18.6
Warbling Vireo,124%,20.4
Scarlet Tanager,206%,14.2
Tennessee Warbler,344%,6.3
[/table]
[/expand]
[expand title=”Decreasing” tag=”h3″]
[table sort=”,asc” tablesorter=”true”]
Species,Decrease from Last Week[attr style=”color:red”],% of Checklists Reporting
Bufflehead,-73%,1.3
Dark-eyed Junco,-67%,2.7
Pied-billed Grebe,-52%,2.1
Rusty Blackbird,-62%,0.9
Horned Grebe,-77%,0.4
Ring-necked Duck,-75%,0.7
Northern Shoveler,-50%,2
Green-winged Teal,-59%,1.4
Blue-winged Teal,-40%,4.4
Bonaparte’s Gull,-55%,1.1
Wilson’s Snipe,-52%,1.2
Lesser Scaup,-57%,1
Ruby-crowned Kinglet,-28%,14.9
Red-breasted Merganser,-43%,2
Hermit Thrush,-29%,6.3
American Coot,-28%,4.2
Red-necked Grebe,-76%,0.1
Purple Finch,-29%,5.8
Ruddy Duck,-42%,1.3
[/table]
[/expand]
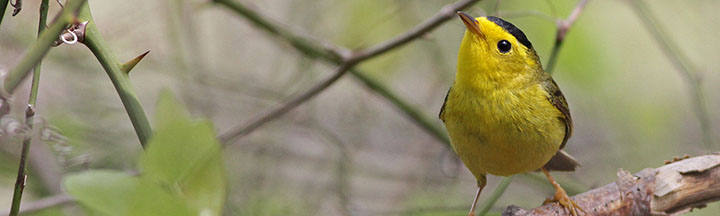
Wilson’s Warbler © Ian Davies
Gulf Coast and Southeast
Top Movers
[expand title=”Increasing” tag=”h3″]
[table sort=”,desc” tablesorter=”true”]
Species,Increase from Last Week[attr style=”color:green”],% of Checklists Reporting
Wilson’s Warbler,124%,2.6
Mourning Warbler,250%,0.7
Willow Flycatcher,134%,0.7
Olive-sided Flycatcher,203%,1.1
Mississippi Kite,24%,5.9
American Redstart,30%,15.5
Hepatic Tanager,87%,0.4
Magnificent Frigatebird,58%,2.6
Semipalmated Sandpiper,18%,4
Alder Flycatcher,210%,0.2
Canada Warbler,26%,2
Cordilleran Flycatcher,92%,0.2
Scott’s Oriole,26%,1
Eastern Wood-Pewee,20%,10
Black-headed Grosbeak,35%,0.7
Western Wood-Pewee,41%,0.4
[/table]
[/expand]
[expand title=”Decreasing” tag=”h3″]
[table sort=”,asc” tablesorter=”true”]
Species,Decrease from Last Week[attr style=”color:red”],% of Checklists Reporting
White-throated Sparrow,-77%,2.4
Ruby-crowned Kinglet,-73%,1.2
Yellow-rumped Warbler,-57%,5.4
Blue-winged Warbler,-83%,0.3
Rose-breasted Grosbeak,-55%,6.5
Nashville Warbler,-49%,2.1
Baltimore Oriole,-40%,4.8
White-crowned Sparrow,-52%,2.1
Scarlet Tanager,-48%,6.1
Swamp Sparrow,-73%,0.4
Veery,-59%,1.8
Palm Warbler,-37%,5
Sora,-68%,0.5
Gray-cheeked Thrush,-61%,1.7
Gray Catbird,-32%,16
Hooded Warbler,-37%,4.8
Blue-winged Teal,-34%,5.9
Broad-winged Hawk,-49%,1.8
Pine Siskin,-41%,3.4
Worm-eating Warbler,-50%,1.6
Swainson’s Hawk,-53%,1.1
Franklin’s Gull,-79%,0.2
Black-and-white Warbler,-27%,11.5
Black-throated Green Warbler,-27%,5.7
[/table]
[/expand]
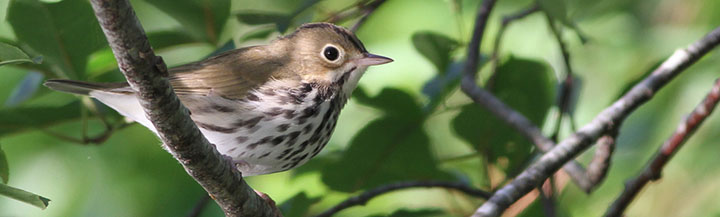
Ovenbird © Ian Davies
Great Plains
Top Movers
[expand title=”Increasing” tag=”h3″]
[table sort=”,desc” tablesorter=”true”]
Species,Increase from Last Week[attr style=”color:green”],% of Checklists Reporting
Rose-breasted Grosbeak,363%,13.6
Least Flycatcher,226%,17.9
Tennessee Warbler,264%,12.4
Gray Catbird,202%,16.7
Yellow Warbler,136%,27.6
Swainson’s Thrush,141%,24.4
Orchard Oriole,165%,12.4
Baltimore Oriole,79%,32.7
Nashville Warbler,141%,14.1
Ovenbird,384%,4
Clay-colored Sparrow,76%,16.7
Indigo Bunting,97%,17.9
Wilson’s Warbler,336%,3.9
Mississippi Kite,155%,6.1
Black-and-white Warbler,97%,10.6
Blue-headed Vireo,177%,4.6
Yellow-billed Cuckoo,252%,3.5
Eastern Wood-Pewee,130%,5.2
Red-eyed Vireo,67%,15.2
Northern Waterthrush,182%,4.5
Dickcissel,44%,10.6
Warbling Vireo,44%,18.3
Red-headed Woodpecker,53%,12.6
Bobolink,243%,2.3
Summer Tanager,53%,11.6
[/table]
[/expand]
[expand title=”Decreasing” tag=”h3″]
[table sort=”,asc” tablesorter=”true”]
Species,Decrease from Last Week[attr style=”color:red”],% of Checklists Reporting
Horned Grebe,-85%,0.3
Pied-billed Grebe,-48%,5.6
Greater Yellowlegs,-51%,3.7
Green-winged Teal,-43%,4.6
Franklin’s Gull,-32%,6.1
Hermit Thrush,-76%,0.3
Marbled Godwit,-43%,2.6
Osprey,-42%,2.1
Snow Goose,-66%,0.6
Blue-winged Teal,-15%,30.1
Ring-necked Duck,-41%,2.1
American Wigeon,-23%,6.4
Wilson’s Snipe,-40%,1.7
[/table]
[/expand]
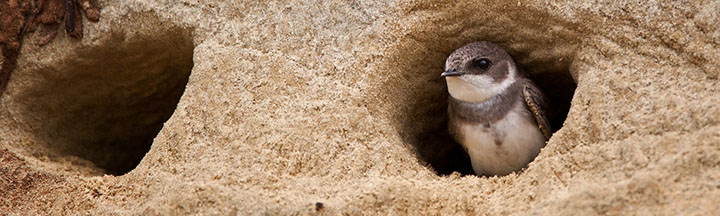
Bank Swallow © Ian Davies
West
Top Movers
[expand title=”Increasing” tag=”h3″]
[table sort=”,desc” tablesorter=”true”]
Species,Increase from Last Week[attr style=”color:green”],% of Checklists Reporting
Western Wood-Pewee,93%,7
Swainson’s Thrush,94%,3.5
Yellow Warbler,34%,18.2
Western Tanager,37%,12.9
Black-headed Grosbeak,30%,19.7
Bullock’s Oriole,32%,13.3
Bank Swallow,132%,3.3
Evening Grosbeak,38%,5.2
Olive-sided Flycatcher,43%,3
Cliff Swallow,44%,16.6
Barn Swallow,32%,25.4
Spotted Sandpiper,29%,8.7
Northern Rough-winged Swallow,47%,14.5
MacGillivray’s Warbler,37%,3.1
Vaux’s Swift,126%,4.1
Yellow-breasted Chat,37%,4.5
Warbling Vireo,26%,11.3
Northern Waterthrush,184%,0.6
Violet-green Swallow,28%,18
Brown-headed Cowbird,20%,20.8
Forster’s Tern,29%,4
Lazuli Bunting,24%,8
Wilson’s Warbler,16%,19.2
Dusky Flycatcher,34%,1.9
[/table]
[/expand]
[expand title=”Decreasing” tag=”h3″]
[table sort=”,asc” tablesorter=”true”]
Species,Decrease from Last Week[attr style=”color:red”],% of Checklists Reporting
Least Sandpiper,-43%,3.4
Western Sandpiper,-44%,2.3
Greater Yellowlegs,-43%,2.3
Golden-crowned Sparrow,-44%,2.7
Green-winged Teal,-38%,4
Dunlin,-45%,1.7
Semipalmated Plover,-44%,1.7
Horned Grebe,-55%,0.6
Greater White-fronted Goose,-53%,0.7
Nashville Warbler,-35%,1.4
Ruby-crowned Kinglet,-29%,4.4
Bufflehead,-31%,4.1
Lesser Yellowlegs,-40%,0.8
Ring-necked Duck,-31%,2.8
Solitary Sandpiper,-45%,0.6
American Pipit,-39%,0.7
Dusky-capped Flycatcher,-39%,0.7
American Wigeon,-23%,4.5
Cackling Goose,-52%,0.4
Black Turnstone,-54%,0.3
[/table]
[/expand]
–––––––––––––––––––––––––––––––––––
Farnsworth and Van Doren
Scientific Team
BirdCast is made possible by the participating scientists at the below institutions, and many other contributors.