Your Local Migration Dashboard
The BirdCast Migration Dashboard provides summaries of nocturnal bird migration patterns, including estimates of the total number of birds migrating, their directions, speeds, and altitudes.
How To Use the Migration Dashboard
Follow the detailed article guide linked HERE.
Type in the county or state of your choice in the contiguous United States, select a date, and begin!
Dashboard Components
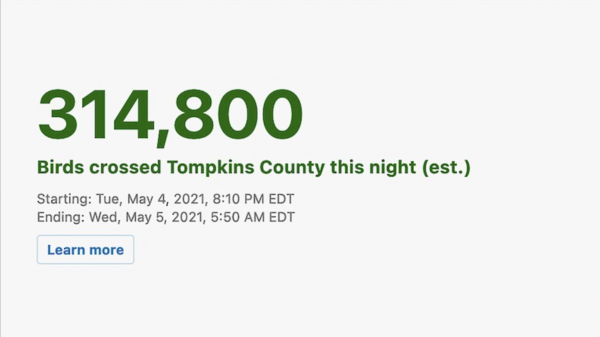
“Birds Crossed This Night”
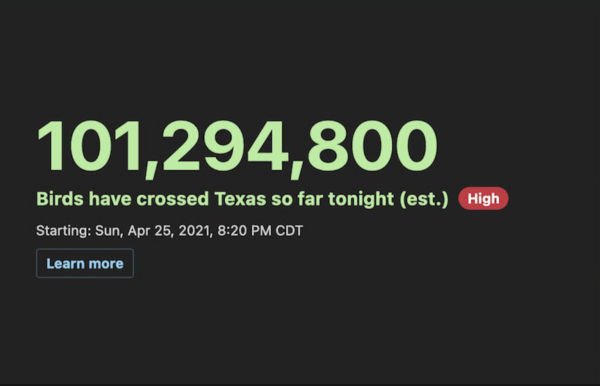
This counter tracks the total number of birds estimated to have overflown an area since the start of a night (e.g. between local sunset and local sunrise).
The number increases more quickly when there are many birds aloft and when they are flying at faster speeds.
This counter can be seen either in “Live” mode during active migration season (black background), or “Historical” mode (white background), for dates from previous migration periods.
“Peak Migration Traffic
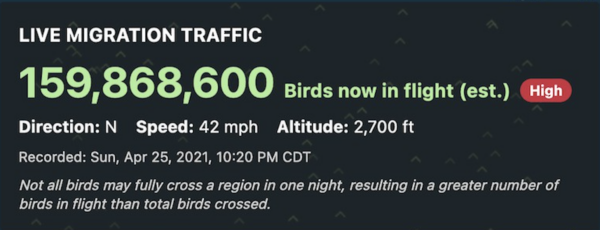
This is an estimate of the total number of birds aloft in an area at the time specified in the local time zone for the selected area.
Also reported here are the average direction toward which those birds are moving, their average speed, and their average flight altitude.
The “High” button in red denotes high intensity migration based on comparisons of live and historical data.
This counter can be seen either in “Live” mode during active migration season (black background), or “Historical” mode (white background), for dates from previous migration periods.
Note: The number of birds in flight may occasionally be greater than the number of birds passed. This occurs when birds do not complete a full flight across a selected area, traversing it only partially.
“Birds In Flight”
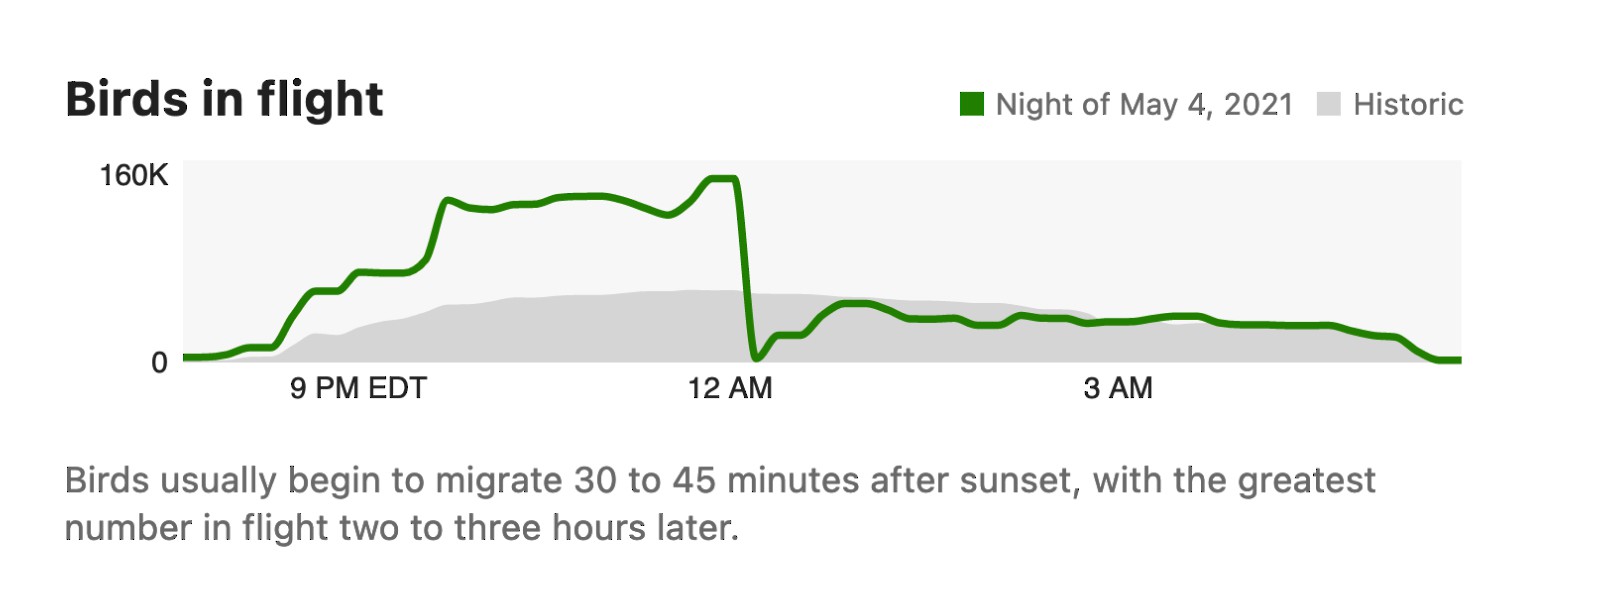
This presentation depicts the pattern of migration traffic over the course of a night (green), relative to historical data from 2013-2021 (gray).
The vertical axis shows the total number of birds in flight above a selected region, and the horizontal axis local time in the time zone of a selected area.
Bird migration patterns vary seasonally and geographically, with potentially dramatic departures from this typical pattern as a result of local and regional weather conditions and migrants’ origins and destinations relative to areas where they cannot land, among other factors.
“Flight Direction and Speed”
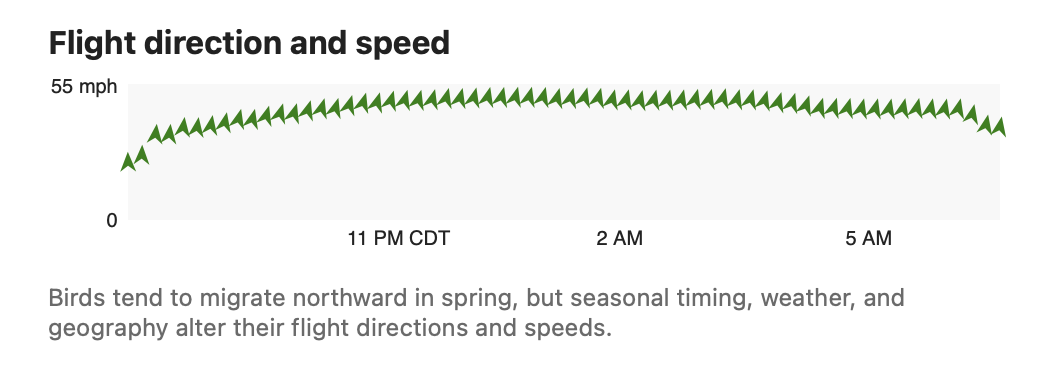
Here, the dashboard shows the flight speed of nocturnally migrating birds (vertical axis) and the direction toward which they are flying (arrow icons) in local time (horizontal axis).
Seasonal timing, weather, and geography alter the flight directions and speeds of migrating birds. Additionally, birds may deviate around local and regional severe weather and concentrating features of the landscape below them (e.g. coastlines).
Note: When numbers of birds are low, flight speed and direction calculations may not be possible, leading to gaps in data. DO WE WANT TO TALK ABOUT GROUNDSPEED AND AIRSPEED HERE?
“Altitude Above Ground”
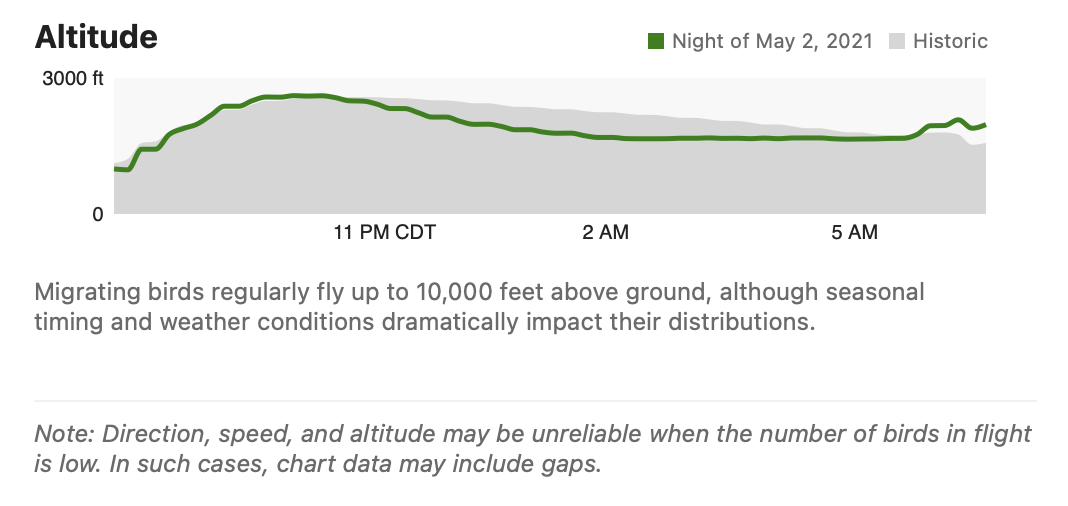
This graph shows the mean flight altitudes (vertical axis), in feet above the ground, over time (horizontal axis). The green line is the time for the selected date relative to historical data from 2013-2021, which is in gray.
Birds generally fly between 100 and 10,000 ft above the ground, though often with a large variation in flight altitude by geography, weather, time of night, and time of season (and some birds, and species, do fly outside of this range regularly).
Note: In mountainous regions radar stations may be positioned at relatively high locations and birds may fly under the radar beam without being detected. Therefore, flight altitudes in mountainous states (e.g. California, Nevada, Oregon, Utah) can be less accurate, and we suggest focusing on the relative changes throughout the night and season, instead of on absolute numbers reported.
Note: When numbers of birds are low, or when precipitation interferes with bird detection in the selected area, altitude calculations may not be possible leading to gaps in data. Occasional reports of incorrectly detected altitudinal patterns may happen during periods when numbers of birds are low, when precipitation contaminates the signals, or during occasional insect emergences or other anomalous atmospheric conditions.
“Birds in Flight (Nightly Average)”
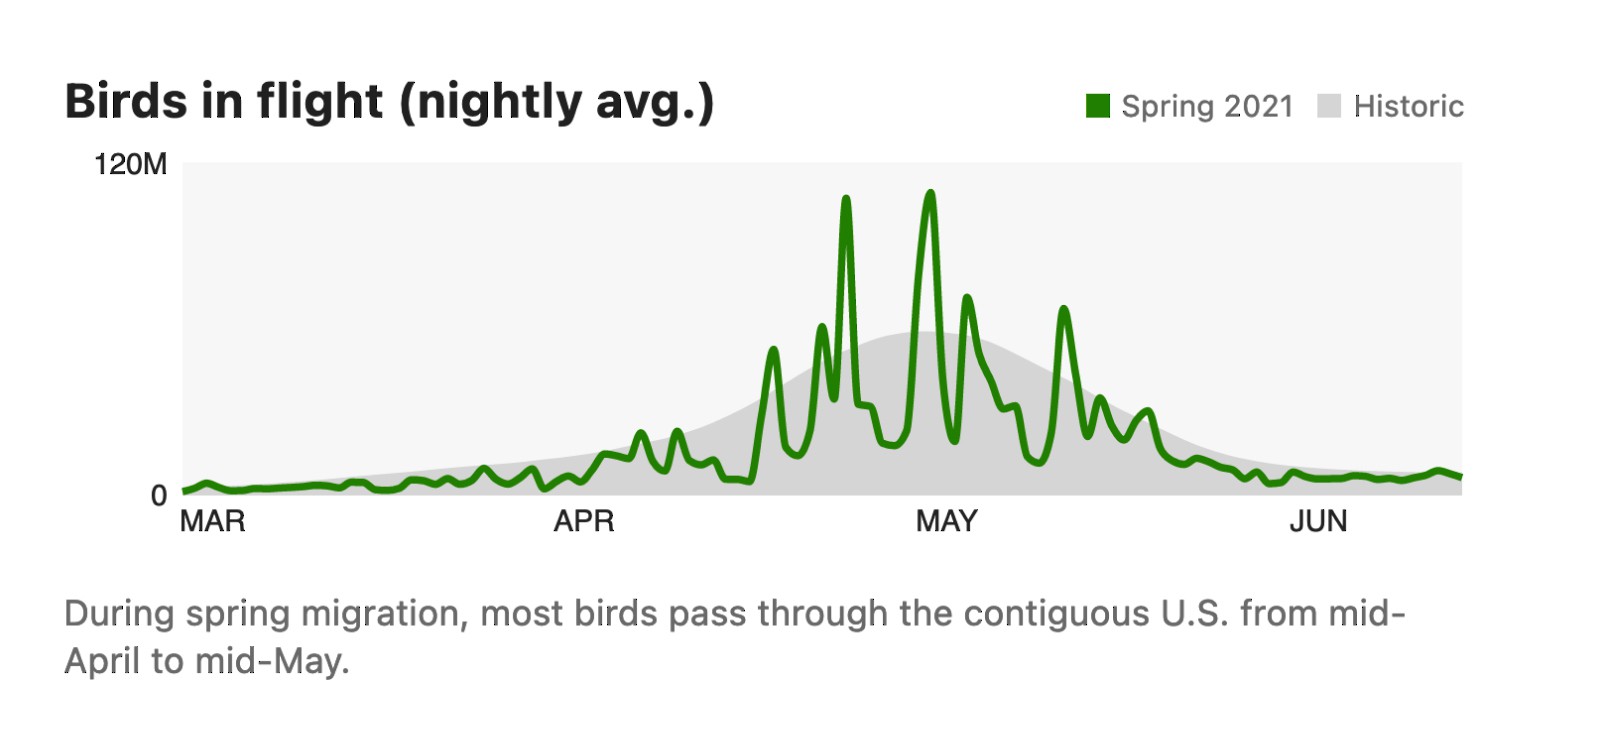
This graph shows the average number of birds in flight for each night for the migration season in which a particular selected date occurs (i.e. spring 2021 in this case) in green relative to historical patterns from 2013-2021 in gray, representing the seasonal trends as an average of years’ migration activity. A vertical bar highlights the specific date selected and corresponds to representations of other nightly migration measures.
“Total Birds Crossed”
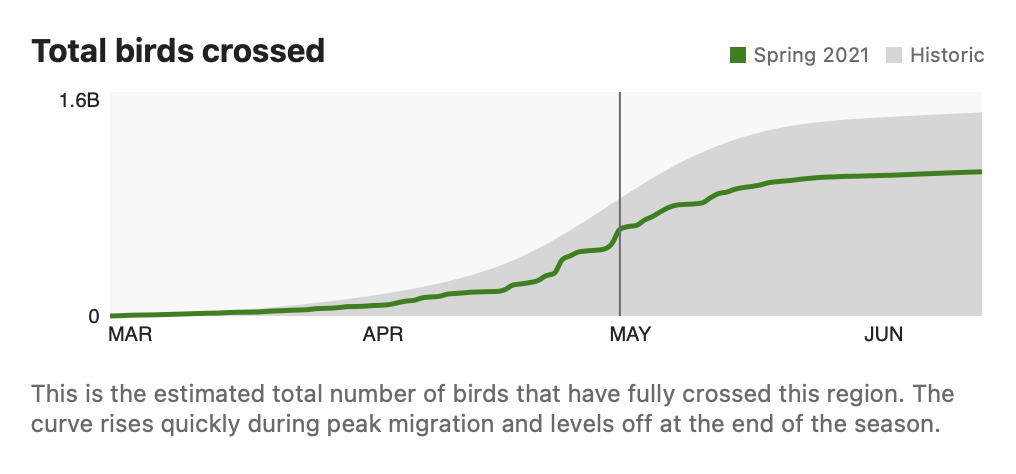
This measure indicates the total number of birds that has flown over an area from the start of migration season.
This cumulative measure rises quickly from a flat line (i.e. a small number) during peak migration, when many birds fly over the region. The line levels off at the end of the migration season at the total number of birds that has crossed the region during the full migration season.
Note: At equal migration intensities, the total birds metric increases more quickly for smaller areas than for larger areas. This is because it takes birds less time to overfly a small area.
“Expected Nocturnal Migrants”
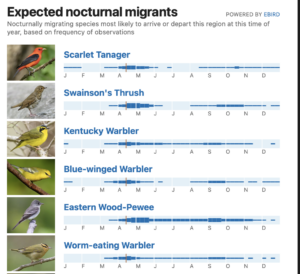
This presentation shows nocturnally migrating species most likely to arrive or depart a selected region at this time of year on a weekly basis, based on frequency of observations from eBird.
Note: There will be some periods when and some places where we do not have sufficient data to calculate this list. Viewers will see “Expected migrants cannot be reliably determined for this region on this night.” This does not mean that birds will not be migrating; rather, this is simply a message to denote that there is insufficient information (too few observations) to produce a species list.
Note: This list does not represent all possible species of migrating birds in a given region, rather those based on a selected county or state and date with a frequency of occurrence greater than 0.01, in 12 weeks or fewer during the year, with fewer than six weeks across the year of zero frequency for a week, and for species with the highest absolute changes in frequencies between the selected and prior weeks.
Note: This list contains almost exclusively birds that migrate nocturnally, meaning species that are likely to occur in nightly or historical radar data; this list will not contain many additional species that may be quite common migrants by day (for example, many species of raptors and swallows). Additionally, this list may not exclude all resident, vagrant, or exotic species that may be present in the region at the selected time.
This is an experimental tool, and we recognize that because of the variation of observers’ habits, migration timing and amount, and geographic variation that not all locations have sufficient data for our data-driven approach to render a meaningful species list that captures the diversity of nocturnally migrating birds. Moreover, our approach does not include any information about counts or relative abundance, a suite of criteria that we would like to employ in the future.
“Off-Season State”
The BirdCast Migration Dashboard data feed is live from March 1 – June 15 in spring and August 1 – November 15 in fall. Live data feed begins each night at local sunset and ends each morning at local sunrise during migration season.
Live migration data are not available outside of these seasonal and temporal windows, but you may browse historical data for any migration dates in 2021 during inactive periods.
Scientific Team
BirdCast is made possible by the participating scientists at the below institutions, and many other contributors.