Project Update: Visualizing Migration
New Maps
This spring, we’ll be tracking migration from many angles. New interactive maps made with eBird data will give us a bird’s-eye view of migration in progress. For example, the following map tracks the northward progression of Tree Swallows in the last few weeks. Zoom in and have a look around!
https://plot.ly/~birdcast/2.embed?show_link=false
Thanks to eBird, we can also track Martins on the move, as they push away from the Gulf Coast:
https://plot.ly/~birdcast/4.embed?show_link=false
And Greater Yellowlegs as they make inroads in the center of the US.
https://plot.ly/~birdcast/6.embed?show_link=false
Updated Charts
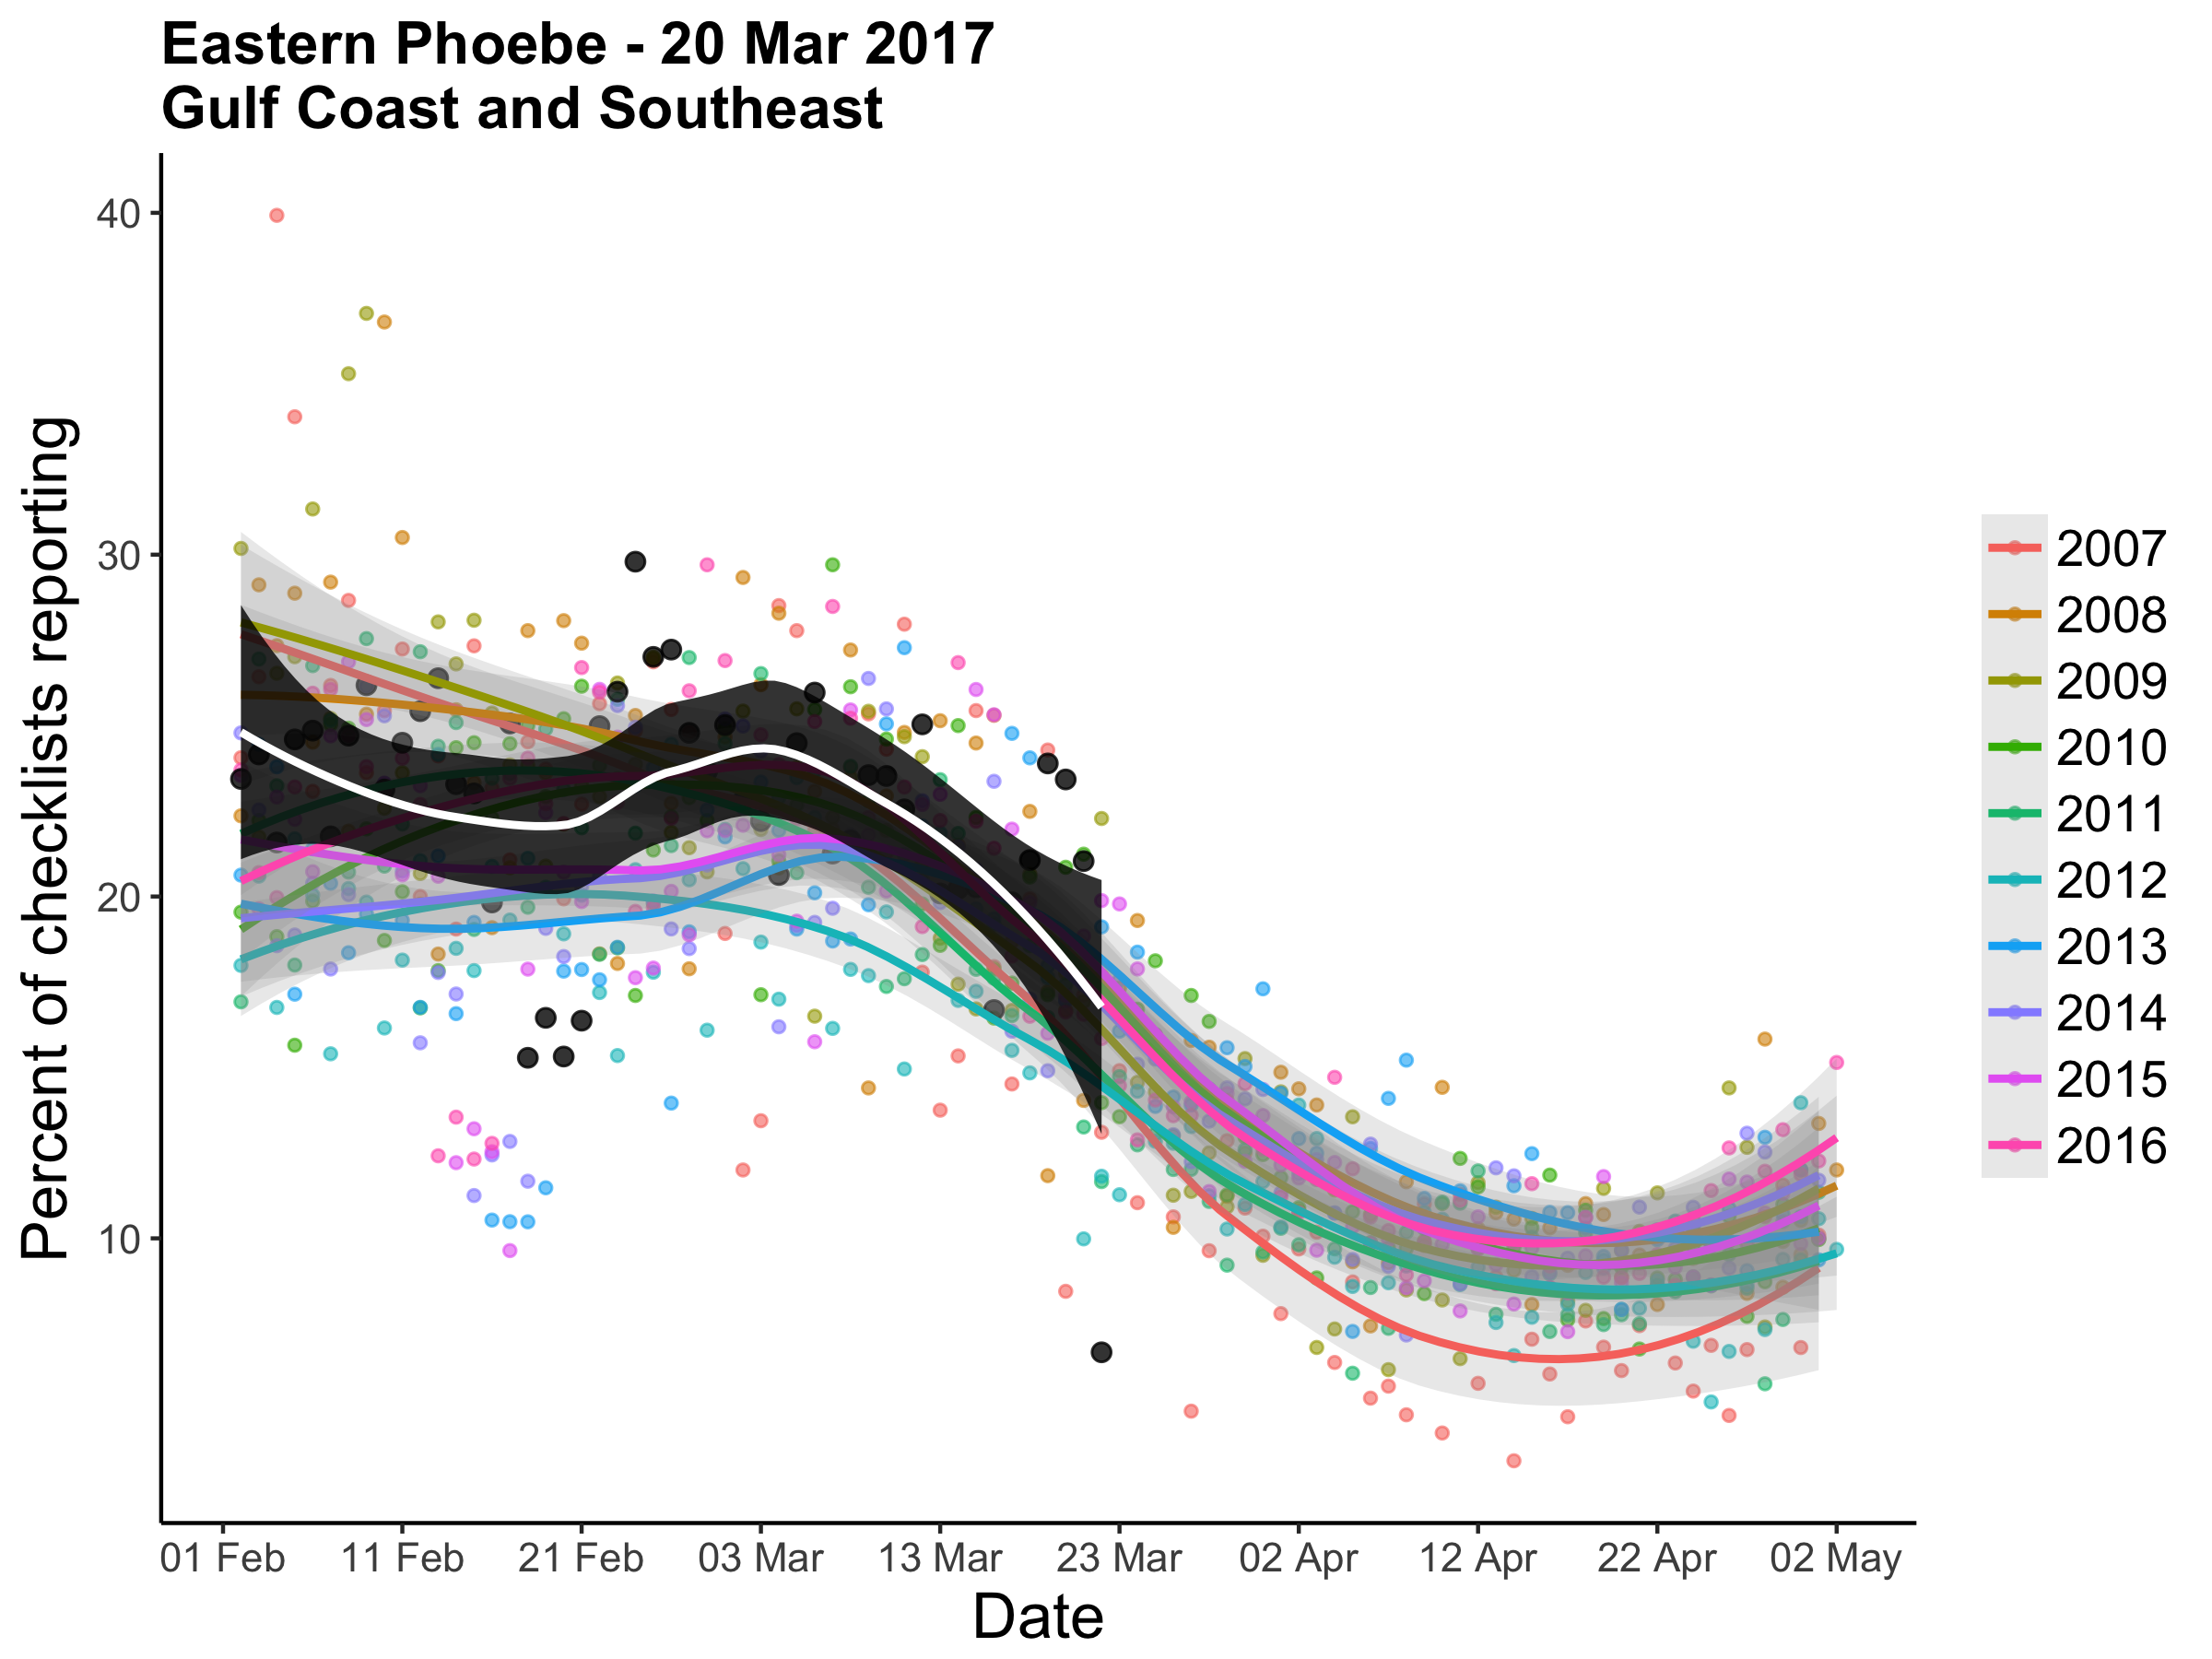
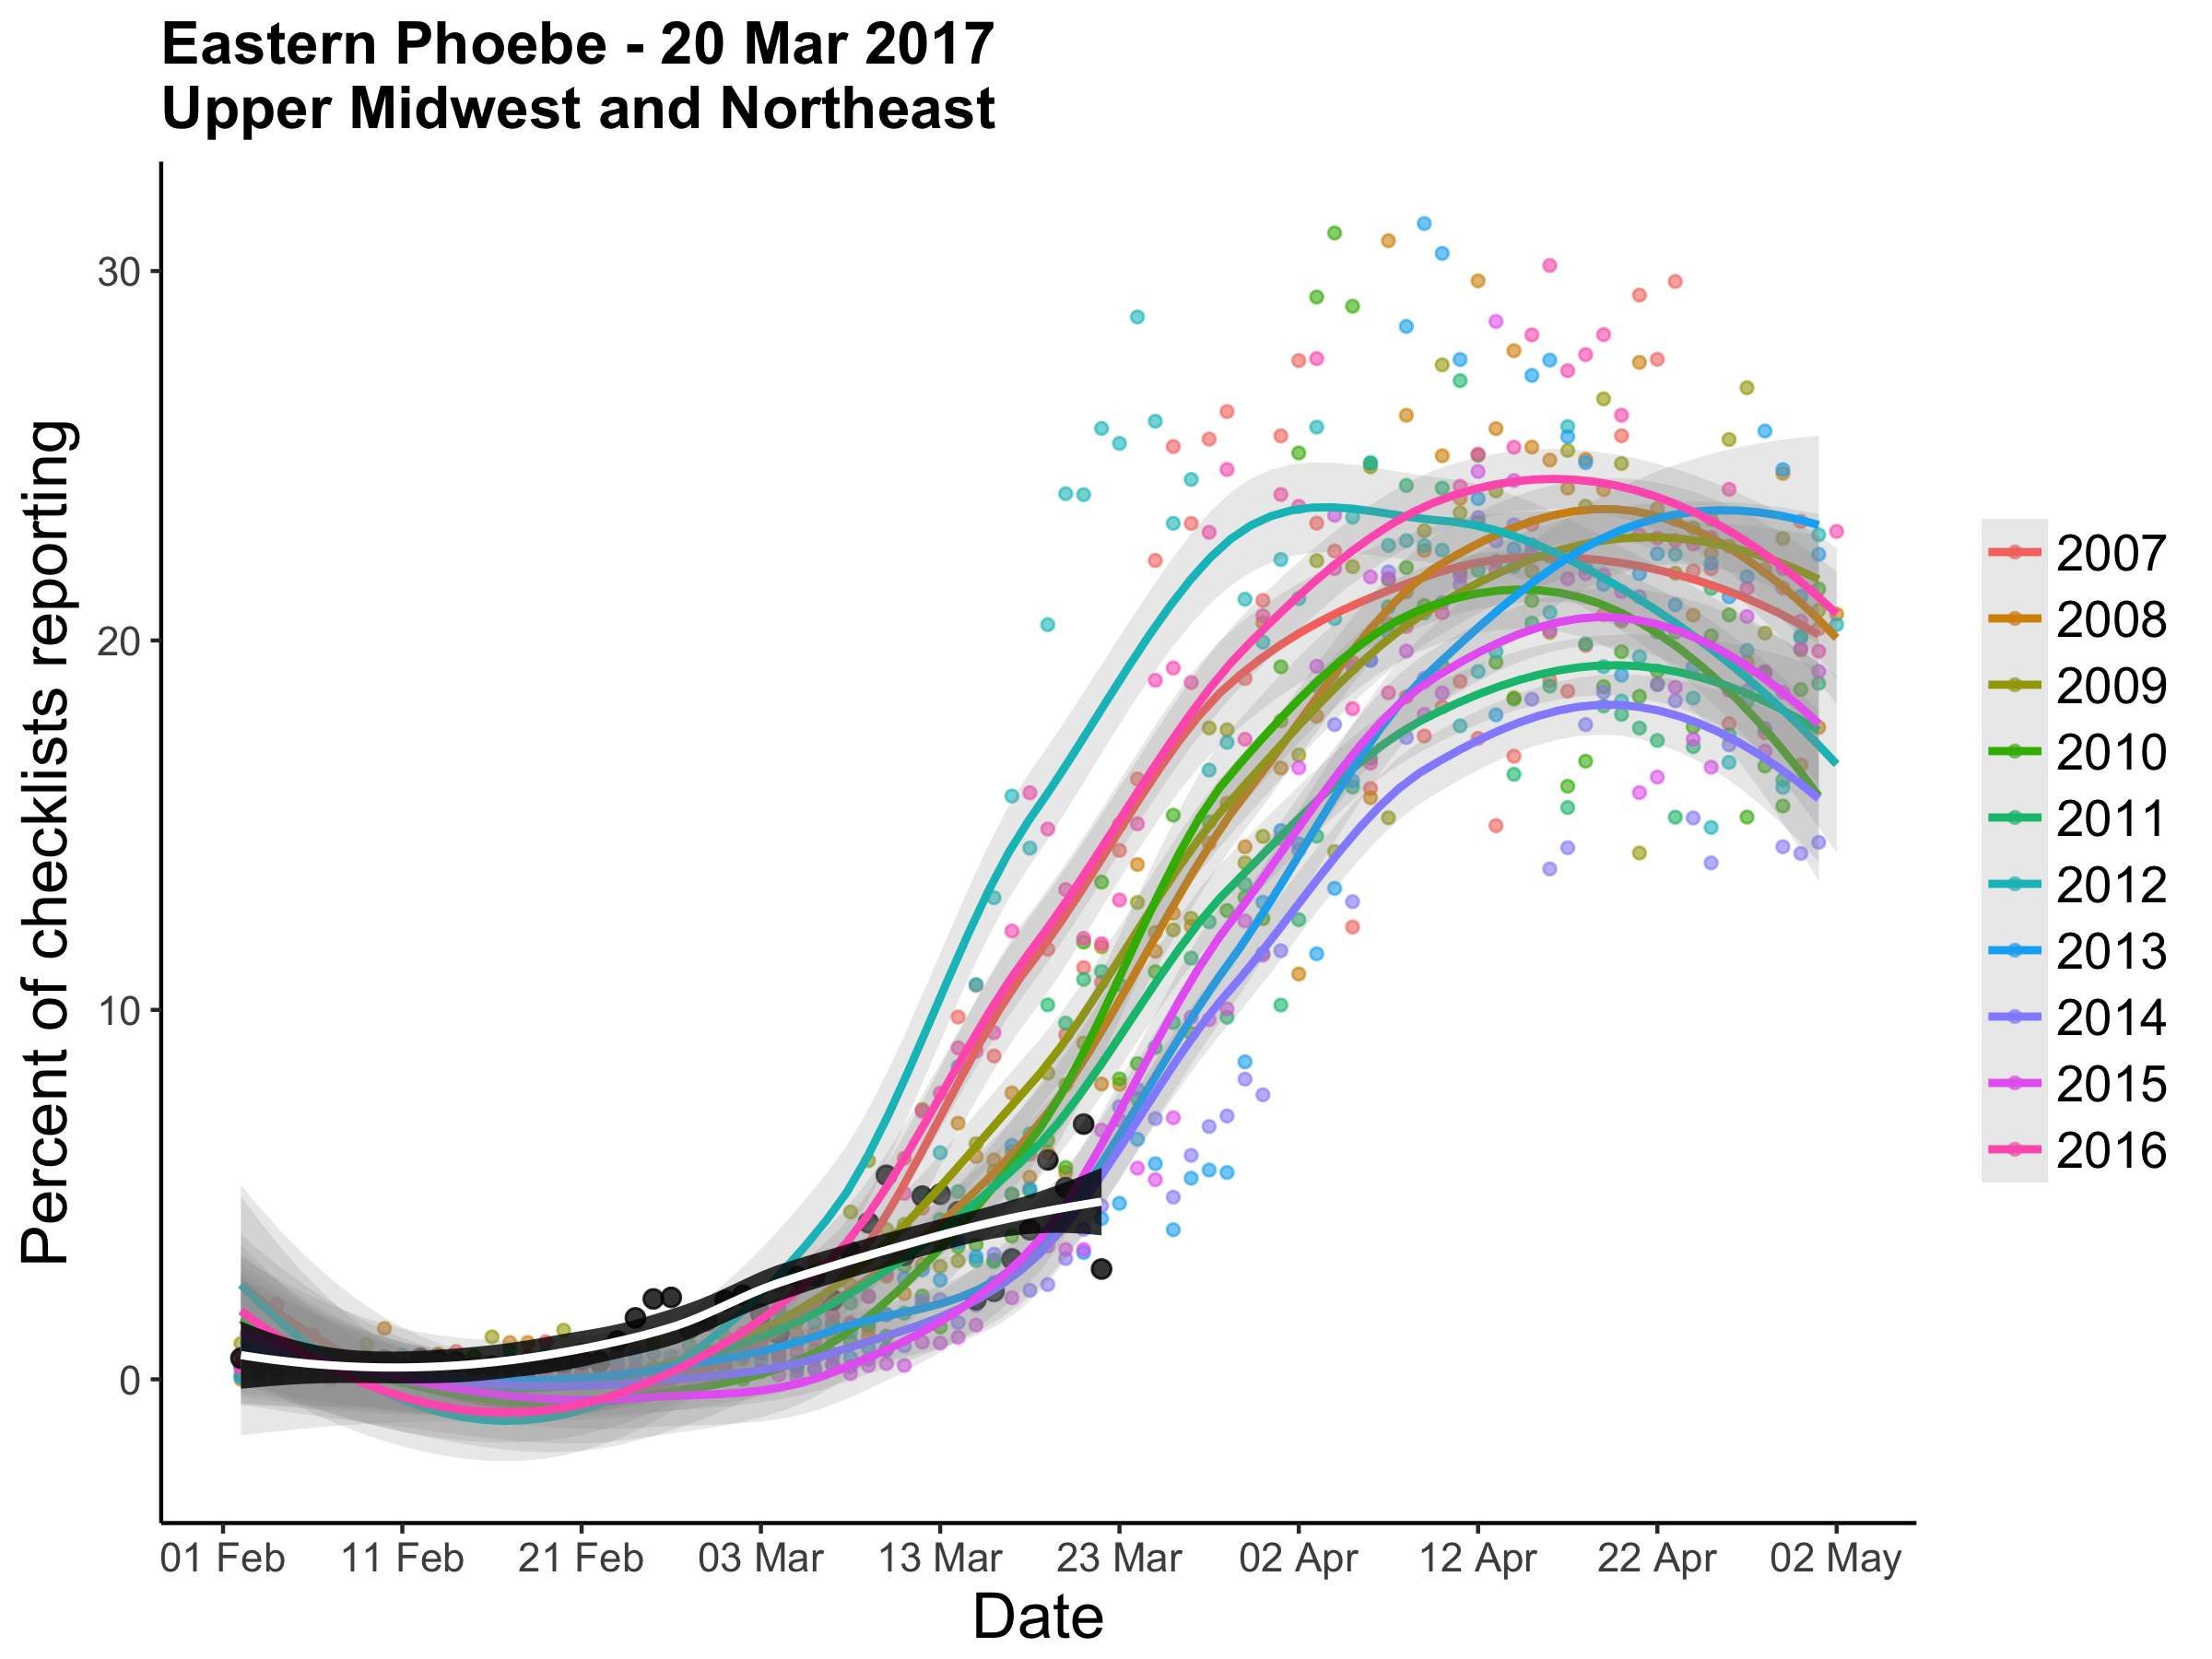
We’ll also make use of line graphs showing the percent of eBird checklists reporting species through time. Below, the black and white line shows the current year, while the colored lines show previous years. We can see that Eastern Phoebes are departing the southeast…
…and arriving in the Northeast & Upper Midwest — although their arrival has slowed in the last few days, perhaps due to recent cold weather.
We’ll be providing frequent migration updates on Twitter this season, such as the ones below, so be sure to have a look at our page.
Purple Martins are pouring through the south; we forecast arrival in the north in 5 d, peak influx in 20 @Aero_Eco https://t.co/i9vrKf2IRH pic.twitter.com/J1Wv0lcpvI
— Team BirdCast (@DrBirdCast) March 20, 2017
Unusual February warmth brought Red-winged Blackbirds to the northeast nearly three weeks early @CornellBirds @NOAA @NOAANCEIclimate pic.twitter.com/nIq7nBa5Bi
— Team BirdCast (@DrBirdCast) March 20, 2017
Next up on the #GulfCoast for spring #migration: Chimney Swift. Keep an eye on this @Team_eBird map in the next week https://t.co/5kyqH3PKU3 pic.twitter.com/Ekzjna9zKq
— Team BirdCast (@DrBirdCast) March 20, 2017
Other species starting to arrive on the #GulfCoast include swallows, Scissor-tailed Flycatcher and Yellow-throated Vireo. pic.twitter.com/g6XELTQX8j
— Team BirdCast (@DrBirdCast) March 19, 2017
Scientific Team
BirdCast is made possible by the participating scientists at the below institutions, and many other contributors.