


Seasonal Recap Spring 2026
Shawn Wallace, Hermione Deng, Adriaan Dokter, Alexander Tedeschi, Andrew Farnsworth
Another spring migration season is long in the books, with billions of migratory birds finishing their breeding routines and preparing for (and engaging in) their return journeys to nonbreeding grounds. The BirdCast team had a busy season: we launched a redesigned website, updated many of our products, and continued existing research while beginning new efforts to improve our understanding of migratory birds, their movements, and the spectacle of migration.
We also worked to expand our network of connections across the country and around the world, attending the 2026 American Meteorological Society Annual Meeting in Houston, Texas, in January. In late June, we also had multiple presenters on site in the Netherlands at the 5th International Radar Aeroecology Conference and Training Workshop. These events help us exchange ideas, share research, and build partnerships for future collaborations.
We look forward to restarting our migration products on August 1, but for now, let’s look back at the spring 2026 migration season! What follows is an account of various aspects of the spring’s movements and patterns, which we encourage you to read. And if you are also inclined, we ask you to watch this video (we told you to expect more of these fantastic creations!), representing another of our new approaches to showcasing the spectacle of bird migration!
Migration Overview
It was another successful season for the team, tracking billions of birds across the contiguous United States with data from 143 NOAA (National Oceanic and Atmospheric Administration) WSR-88D stations. In total, we recorded approximately 18 billion bird detections when we summed the peak number of birds aloft each night across the migration period. Importantly, this does not mean that we tracked 18 billion individual birds: the same bird can be detected on multiple nights as it migrates. The number of individual birds represented this spring is likely closer to 4-5 billion.
Each spring, roughly 3.5 billion birds enter the United States through our southern coastlines and across the border with Mexico. Around 2.5-3 billion continue north through the United States and into Canada. Another estimated 1-2 billion begin spring migration from wintering areas within the United States, and some may complete their entire annual cycles without crossing either international border. Most migration happens at night: more than 80% of migratory bird species in the U.S. move under the cover of darkness!
Migration by the Numbers
Texas recorded the highest bird migration total of any state in spring 2026, with more than 1.3 billion birds passing through the state. Many arrived from Mexico or points farther south, including large numbers crossing the open waters of the Gulf of Mexico. Migration in Texas peaked on May 2 and May 3, when peak estimates reached 158 million and 160 million birds in flight, respectively.
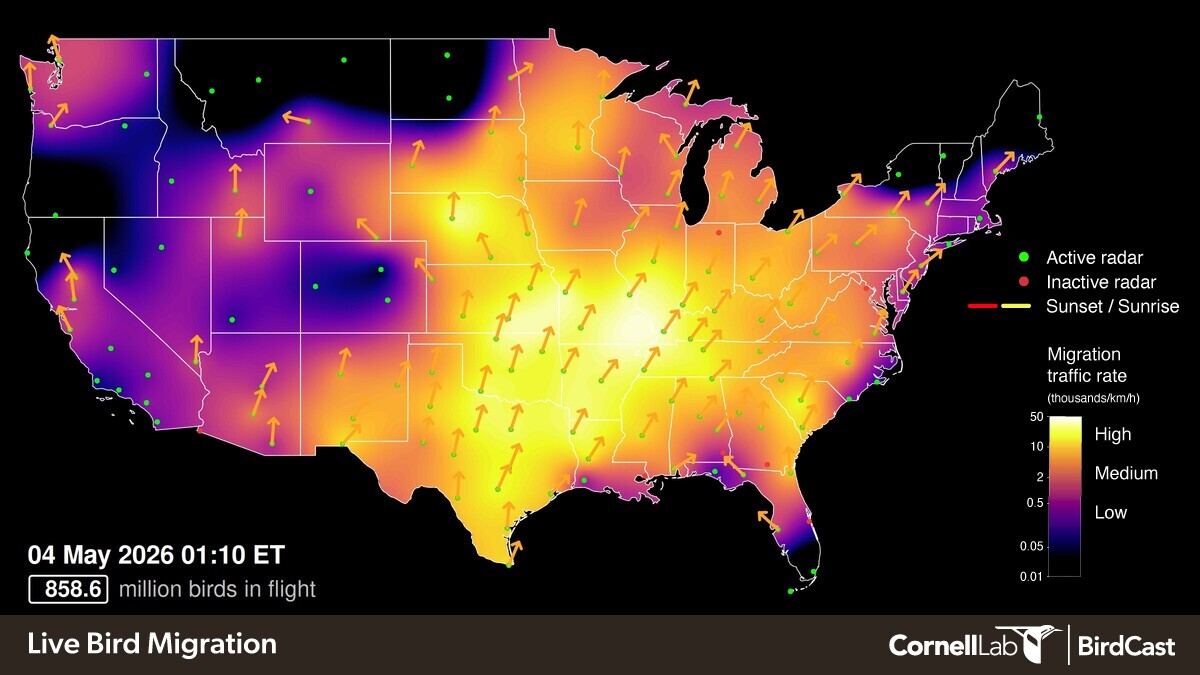
The night of May 3-4 was also the biggest spring migration night recorded by BirdCast in the U.S., with nearly 858 million birds in flight shortly after 1:10 a.m. EDT.
So what made this the night to go? This enormous movement coincided with the seasonal peak in migration intensity across much of the United States. In addition to circadian clocks, which keep some species on tight migratory schedules, many birds base at least some departure decisions on weather. Temperature changes, favorable tailwinds, and an absence of precipitation can all help set the stage for migration. Timing matters: birds must also arrive when critical resources, such as emerging insects, are available.
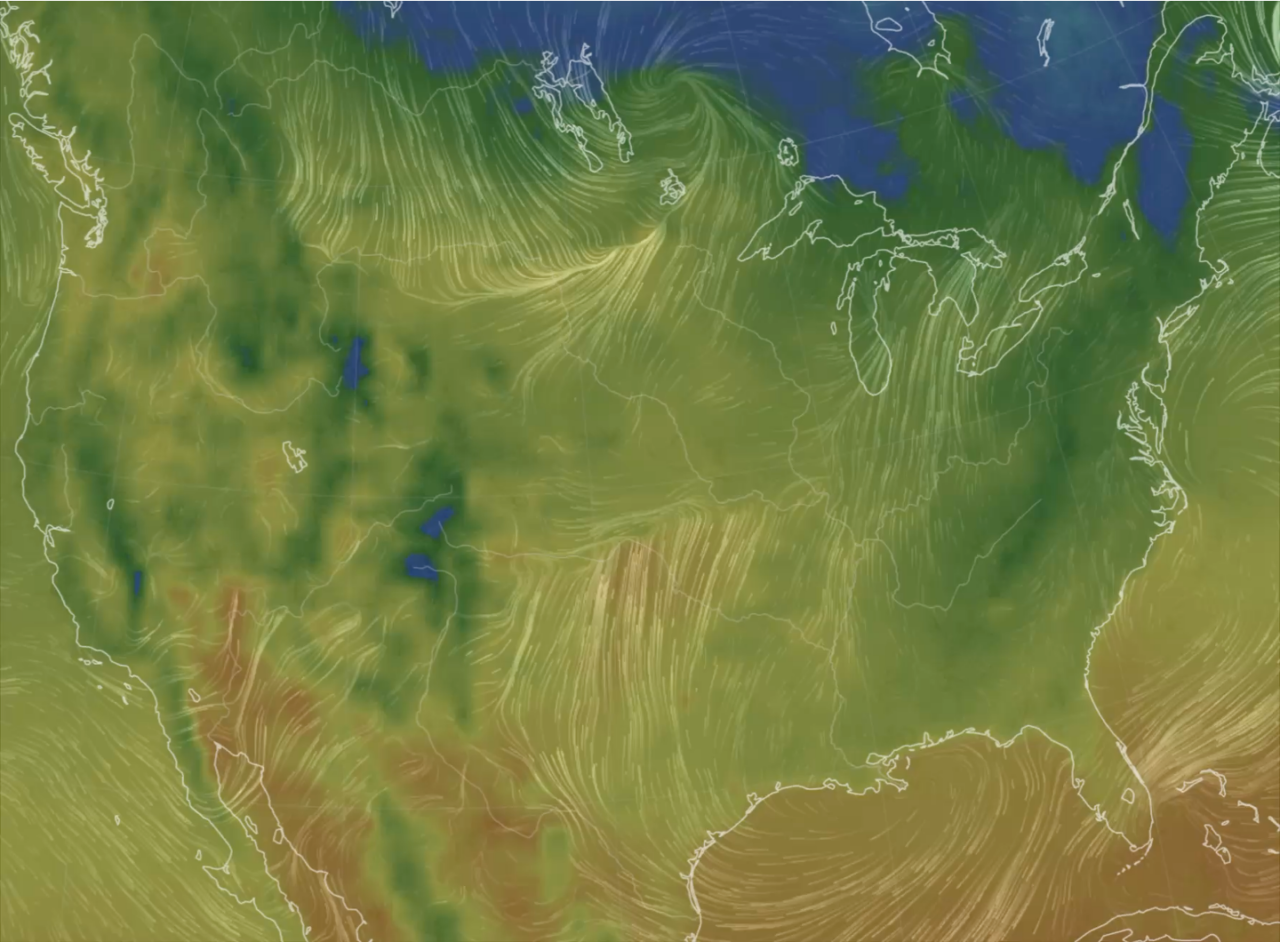
On the night of May 3, warm conditions appear in the light orange, yellow, and bright green colors. Many wind vectors point north across the United States, indicating supportive tailwinds. Vectors pointing south would indicate northerly headwinds, often associated with fewer migrants aloft or shorter flights. With widespread southerly flow during the seasonal peak, conditions were favorable, and birds took advantage.
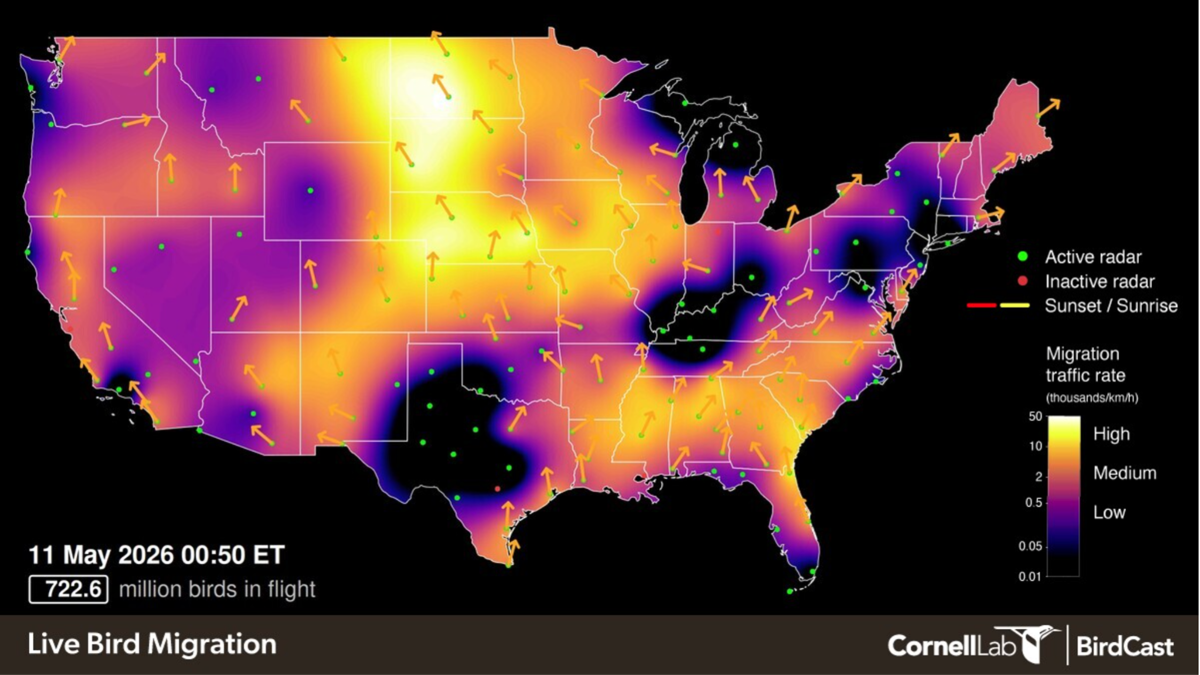
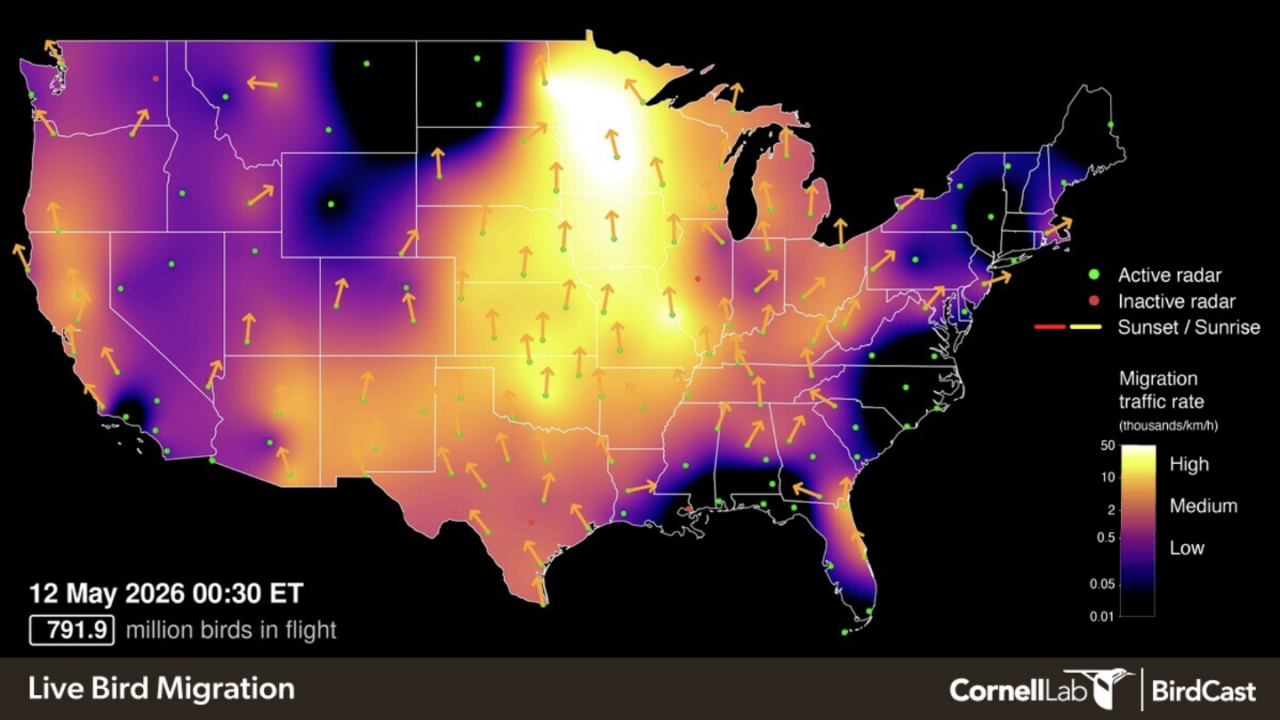
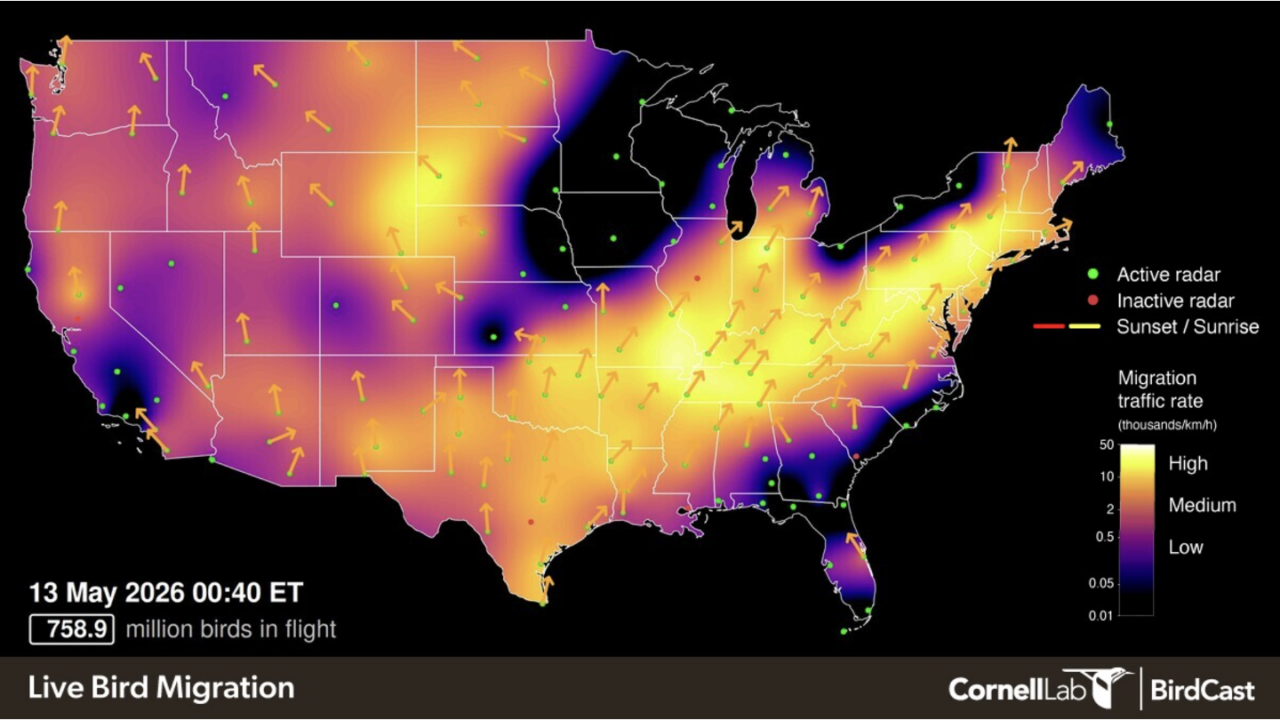
A little more than a week later, we had three back-to-back-to-back (yes, that’s a lot of backs!) nights when more than 700 million birds were aloft. Each night featured different migration hotspots as a cold front advanced across the United States. In the three still images below, the main corridor of migration shifts from west to east. The expanding dark area west of the most intense migration shows where the front had passed and indicates its reach. Together, those three nights accounted for close to 2 billion birds in flight.
Now let’s look at a few especially interesting examples of how weather shaped migration.
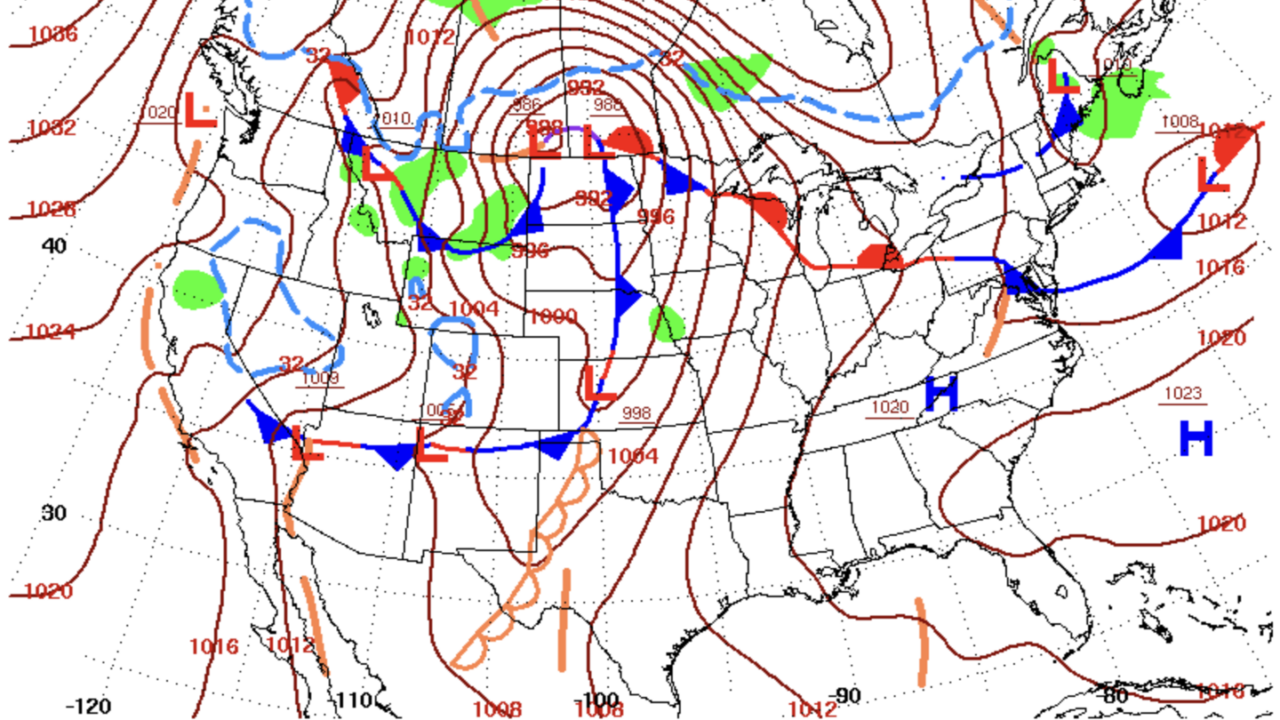
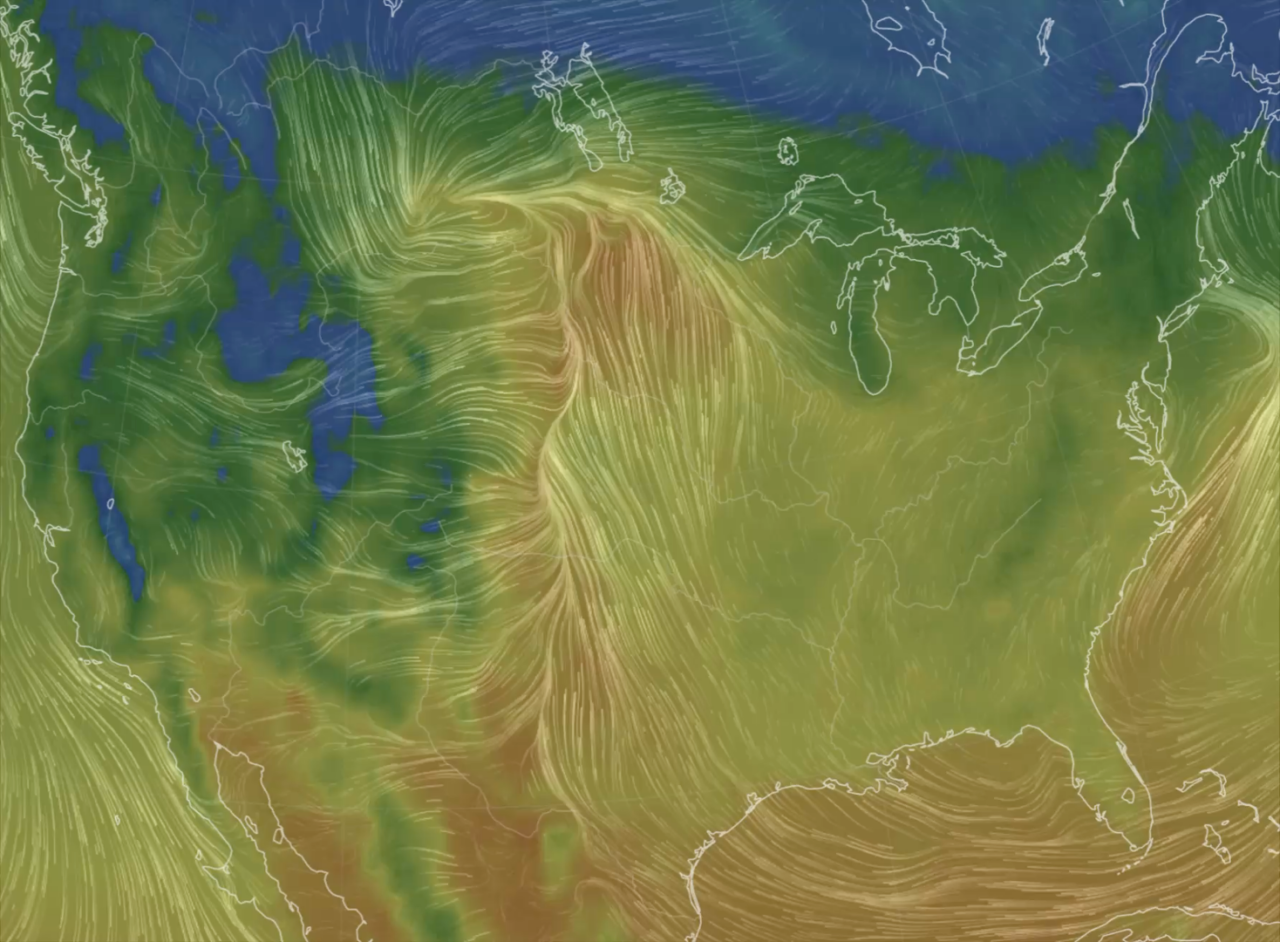
April 18 falls near the beginning of peak migration in Texas, yet it produced one of the lowest migration intensities of the entire season.
A very large cold front stretched from Texas to New England. With strong northerly winds (headwinds for spring migrants!) and much colder-than-average temperatures, bird migration nearly ceased across much of the central and eastern United States. By contrast, migration surged far to the southeast ahead of the frontal boundary, including in Florida, southern Georgia, and South Carolina, where warm air and weak or southerly winds remained in place. It was one of Florida’s biggest migration nights of the season, especially in Monroe County, which includes much of the Everglades and the Florida Keys, as shown in the migration dashboard below. The Pacific Coast also experienced high migration intensity because the front did not affect that region.
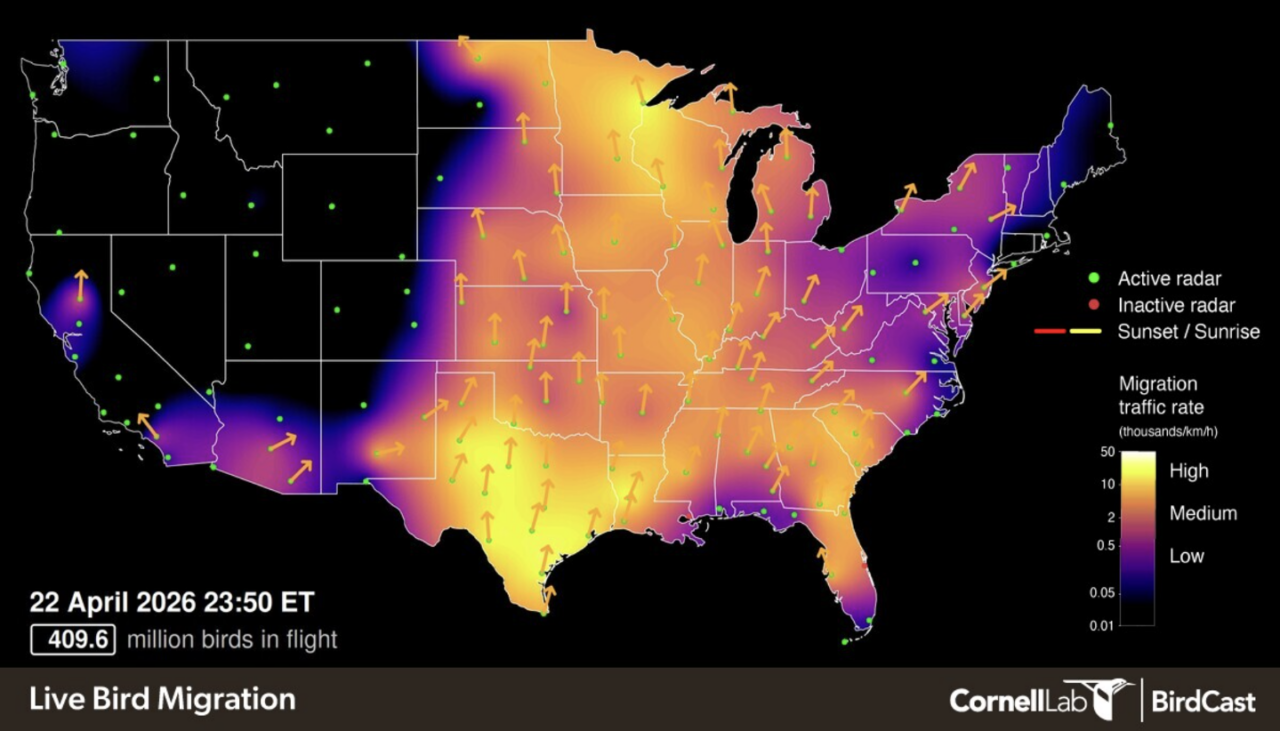
Fast-forward a few nights to April 22-23, when migration exploded as seen in the images above. Cold temperatures and unfavorable winds gave way to Gulf moisture, warmth, and southerly flow accompanying a lifting warm front, and tens of millions of birds took flight and headed north again. More than 83 million birds passed through Texas, making it one of the state’s best migration nights of the spring, while the largest nationwide snapshot approached 153 million birds aloft. Across the country, more than 400 million birds took flight, taking advantage of favorable flying weather.
Fallout Events
This past migration season featured several impressive fallout events, although there were surely more than the two highlighted here! A fallout occurs during spring or fall migration when adverse weather – often heavy precipitation, headwinds, turbulence, or the passage of a frontal boundary – interrupts flight and forces birds down. Birds over land may land abruptly; those over water may descend close to the surface and immediately seek a place to land. Birds that fall out may be exhausted or depleted of energy, and they often concentrate in the first available shelter or green space to feed and rest.
A fallout occurred in Monroe County on the night of May 3-4. Several impressive checklists were logged in eBird, including these from Dry Tortugas National Park (see 1, 2, 3, and 4) and other locations around Key West, home to the southernmost point in the contiguous United States.
The BirdCast Migration Dashboard for Monroe County, Florida, shows a large morning flight arriving early on May 4. Many migrating passerines stop flying around sunrise to rest and feed, and Monroe County represented their first real opportunity to do so after flights from Caribbean islands and South America.
These birds also stopped in response to the combined circulation of high pressure near the Gulf Coast and low pressure centered over the Bahamas. In the Northern Hemisphere, high pressure circulates clockwise (anticyclonically), while low pressure circulates counterclockwise (cyclonically). In this case, their combined circulations produced strong northerly headwinds over Florida, conditions that migrants avoid when possible. Many birds therefore stopped at the southernmost land available in Florida.
Another fallout was reported by Jude Szabo, Jeff Skevington, Markus Legzdins, Max Segler, and Nathan Hood on Caribou Island, Ontario, on May 19. This small, remote island lies on the eastern side of Lake Superior. The observers picked an incredible day to visit: their checklists indicate that they saw more than 9,000 birds, over 95% of which were migratory passerines!
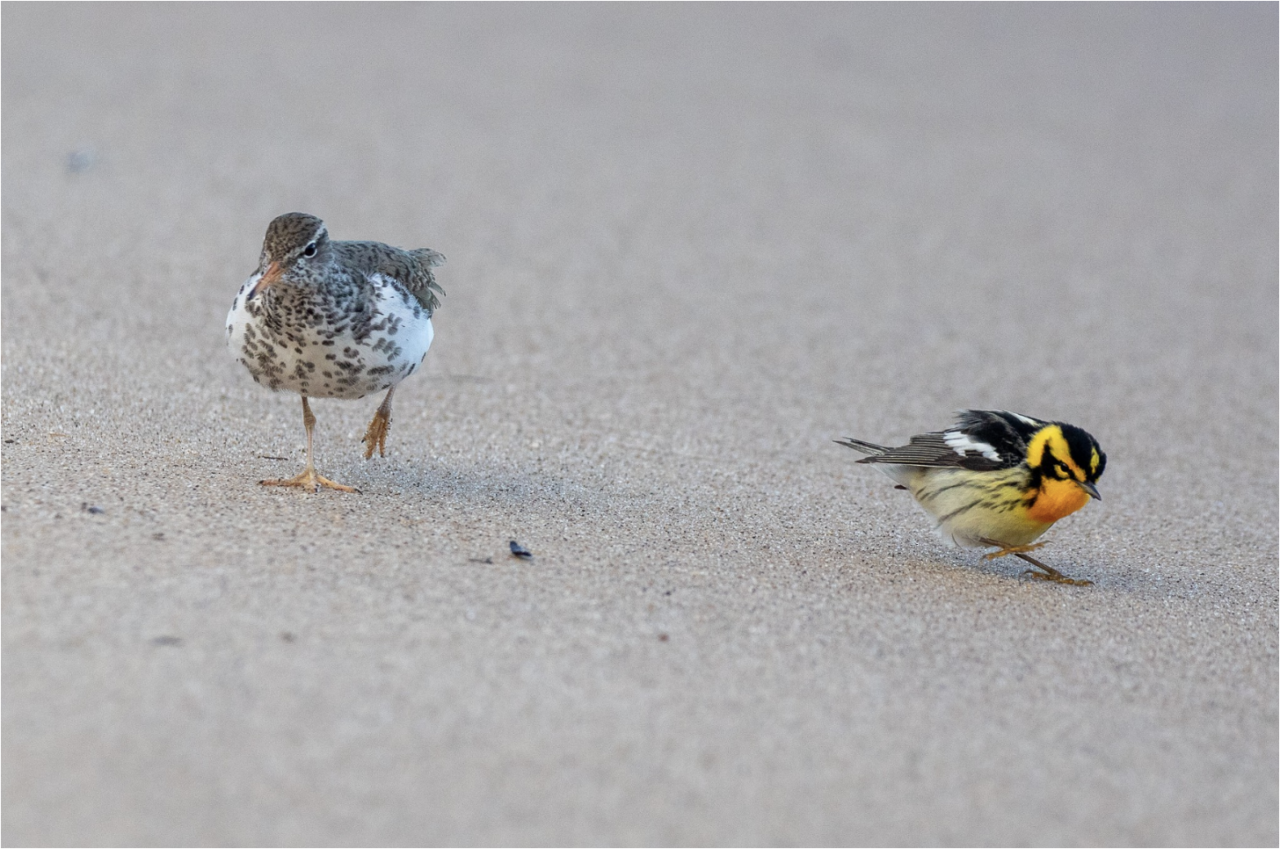
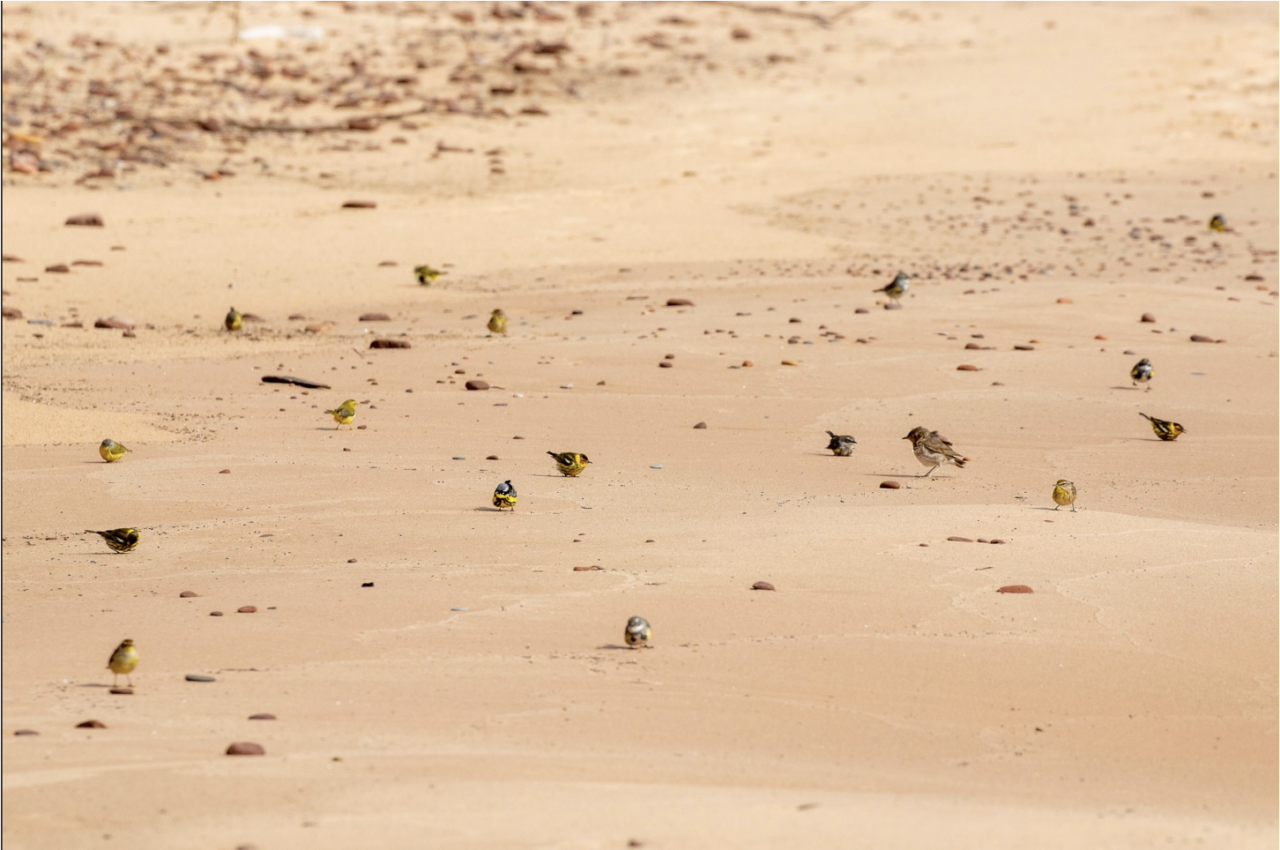
This fallout was caused by a midlatitude cyclone, the technical term for a center of low pressure moving from west to east through the middle latitudes. As in our Florida example, winds around low pressure circulate counterclockwise: colder air and northerly winds move south on the western side, while warmer air and southerly winds move north on the eastern side. During the early evening, a warm front brought warm temperatures and southerly winds into the region and across the lake, spawning nocturnal migration in Michigan and Wisconsin. In the early morning, however, the low passed north of the island and a trailing cold front swept in, rapidly replacing warm conditions and southerly tailwinds with cold conditions and northwesterly headwinds. Birds traveling over the open water were forced to land wherever they could – in this case, cold, windy, foggy, and rainy Caribou Island!
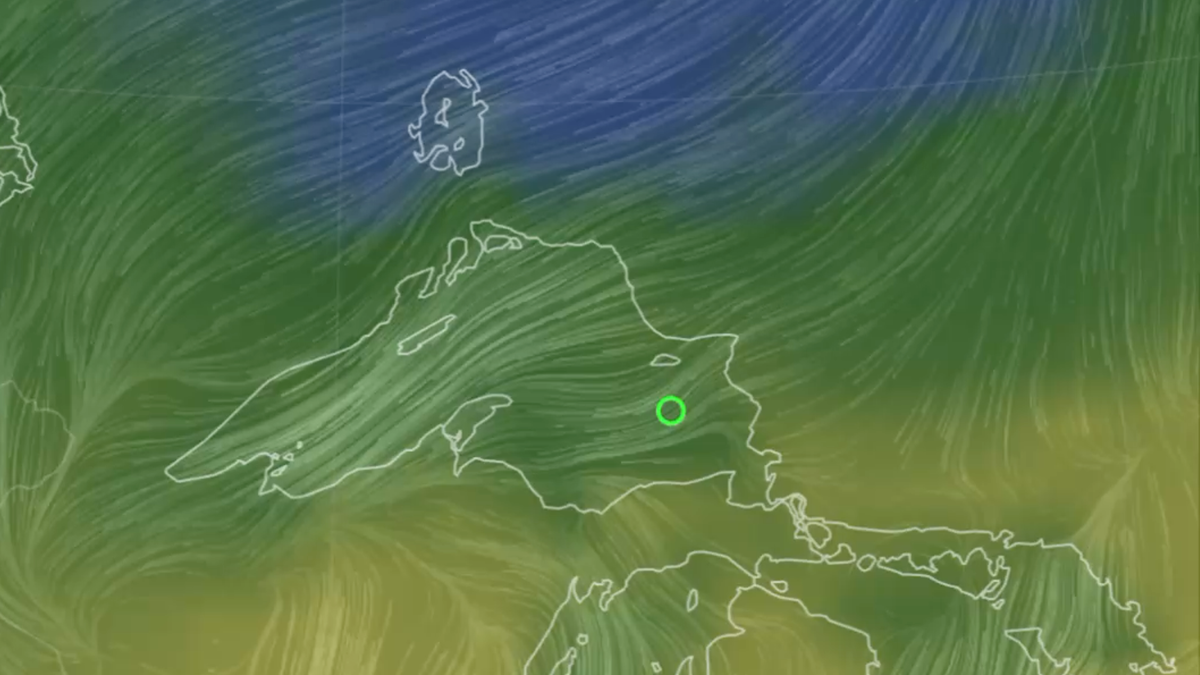
The observers even noted reverse migration: birds flying south, opposite the direction of their intended destinations, in response to the cold and unfavorable conditions. Check out the photos and list here!
State Trends
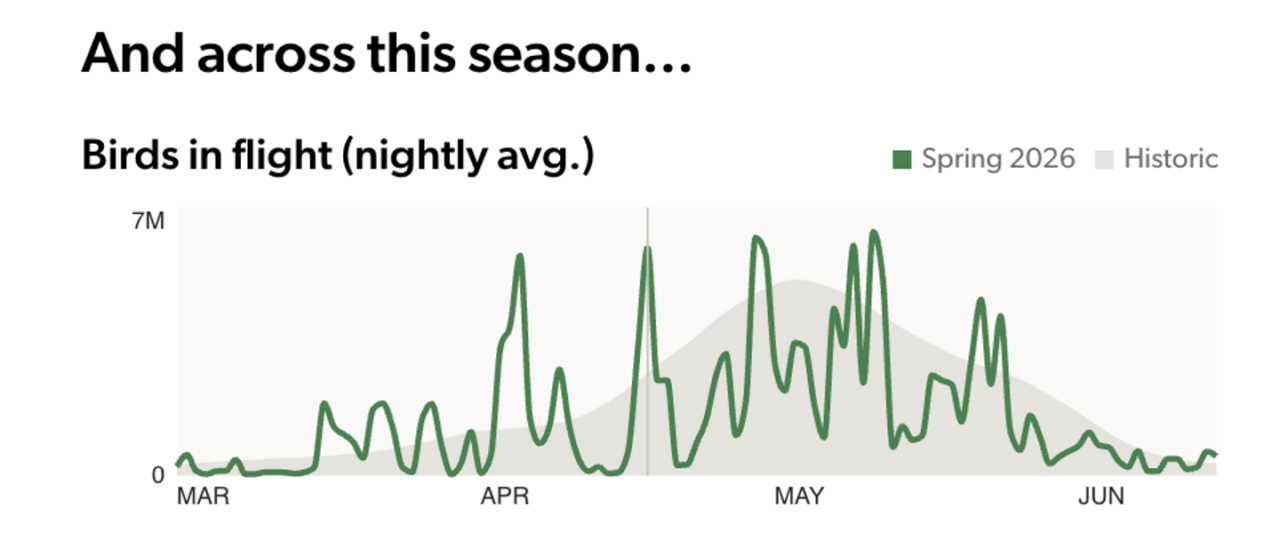
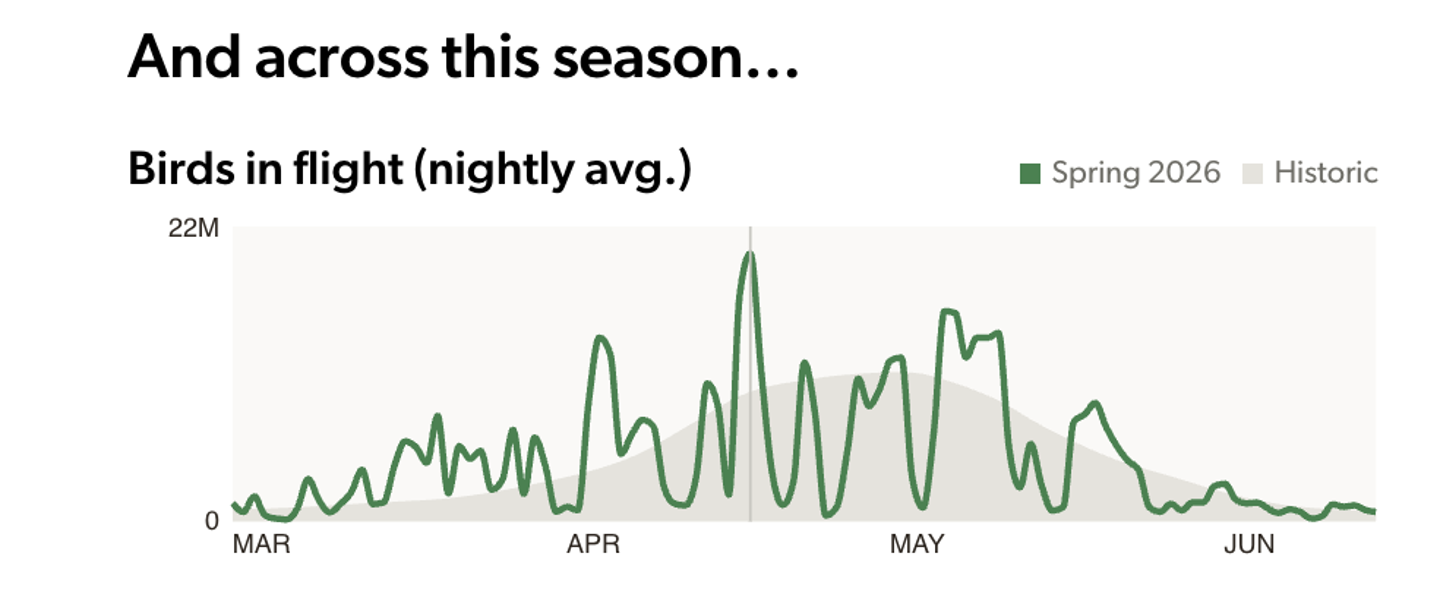
Let’s look at several states with interesting trends from this past season. Washington showed a recurring pattern of large migration events followed by quieter periods, along with a notable early-season pulse. Note the large peak at the left of the graph, well before the gray historical curve in the background. Across the full spring season, Washington radars detected fewer birds than the 10-year historical average.
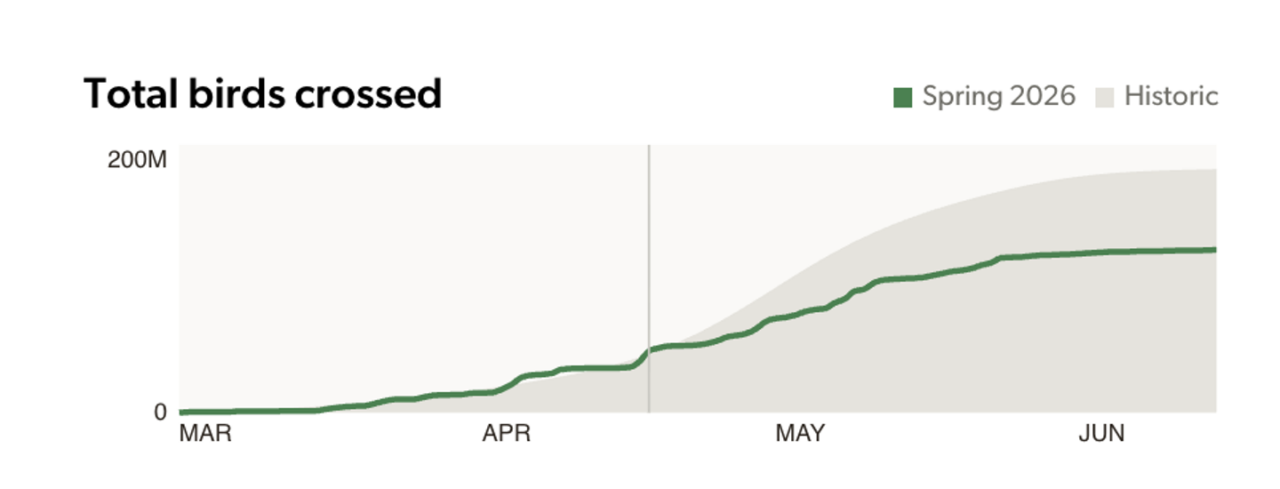
Much of the West Coast recorded below-average migration, whether by a substantial amount in Washington and Oregon or a smaller amount in California. This pattern could reflect several factors, including dry weather during much of the migration season and a fairly persistent ridge of high pressure over the eastern Pacific. In the Northern Hemisphere, high pressure circulates clockwise; with its center offshore, the system’s eastern flank can favor northerly flow down the West Coast. To visualize this, imagine a clockwise circulation centered over the ocean: along its eastern side, air generally moves from north to south along the coast.
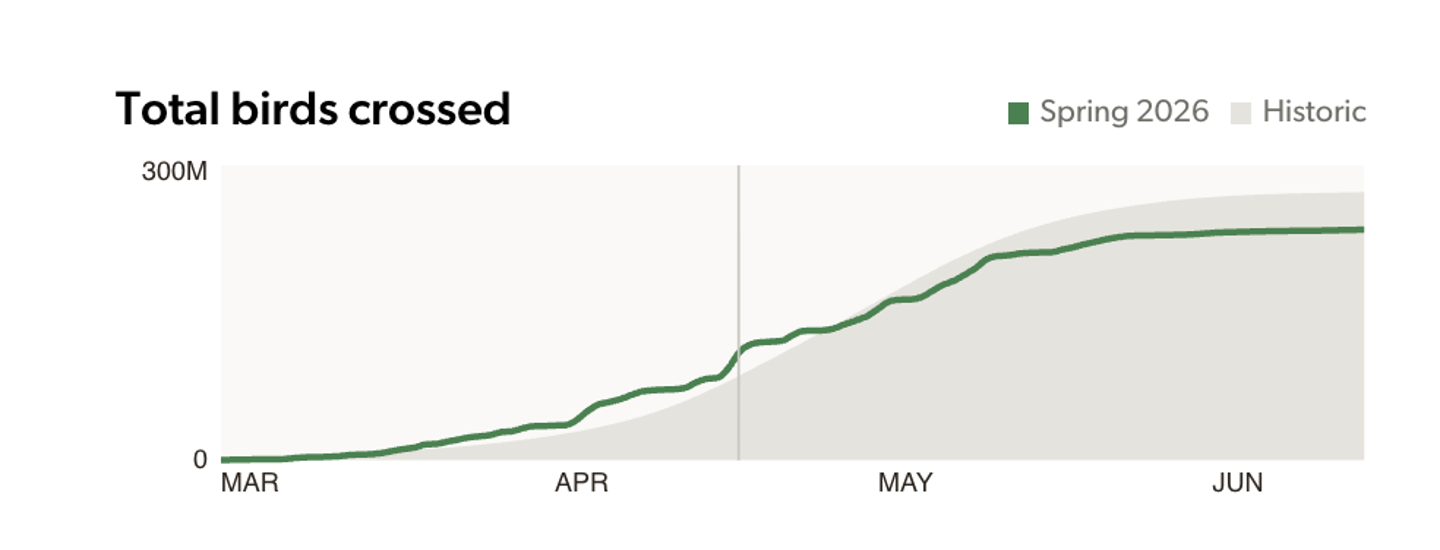
New York also exhibited interesting trends. Its birds-in-flight graph shows several impressive migration nights but is otherwise less variable than Washington’s. Intriguingly, cumulative migration through New York was far above average, placing it among the states with the largest positive departures from historical norms. Different weather patterns may have concentrated more birds or favored routes through the state.
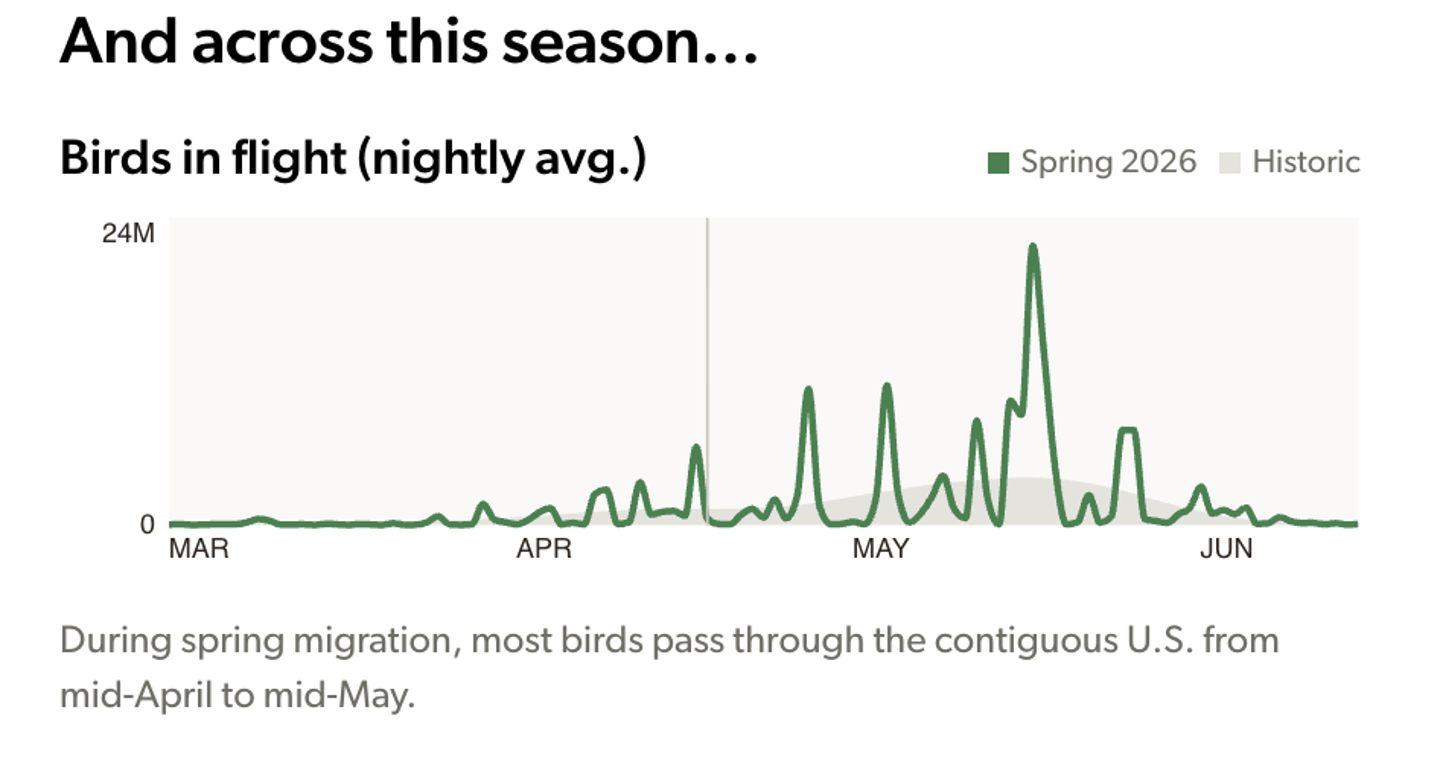
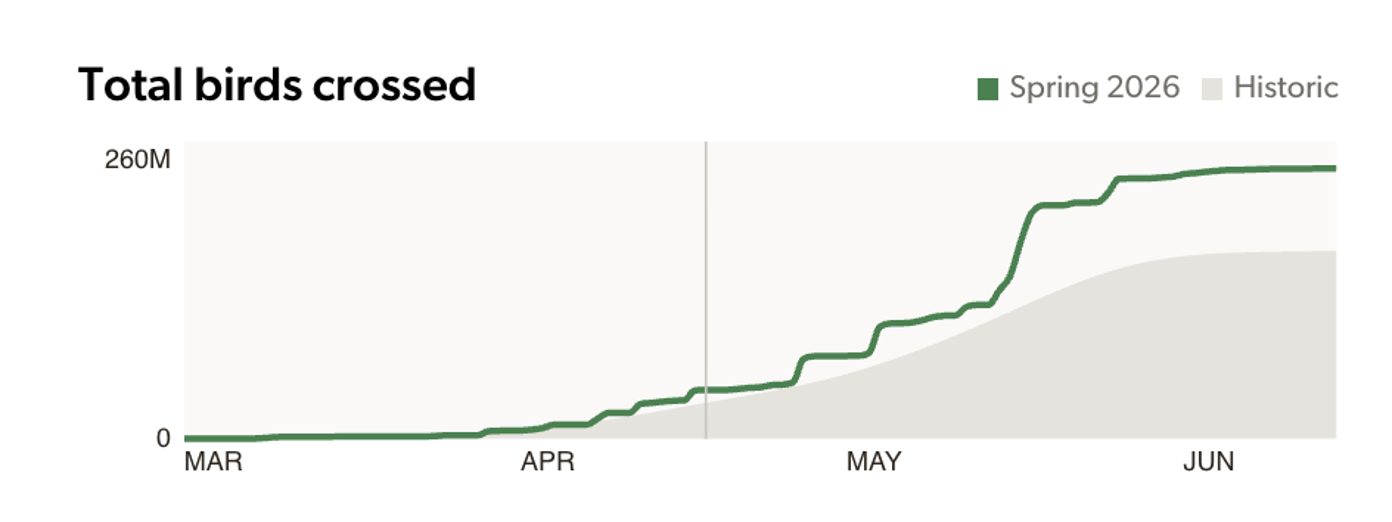
Finally, California also experienced notable early migration, as did much of the West Coast. Unlike New York and Washington, however, California finished near its historical average, just below the typical total for spring migration.
How You Can Help Migrating Birds
Many birds have now returned to their breeding territories, and some are already tending nestlings or fledglings. Head outdoors and look for them in suitable breeding habitat near you! Merlin and eBird can help you learn which birds may be in your area; explore their apps and websites if you haven’t already.
You can also help keep birds safe! More than 1 billion birds die in collisions with glass each year in the U.S. Birds cannot distinguish where habitat ends and glass begins: they try to fly through transparent glass or toward reflected habitat. Treat the outside surface of windows, spacing adhered markers no more than 2 inches apart or hanging treatments 3-4 inches apart. Consider treating glass on your property if you have not done so already, or advocate for effective retrofits on larger buildings near you. To learn more visit the Bird Collision Prevention Alliance website to find out all the ways you can help prevent collisions.
Another way to help is to keep cats indoors! Free-ranging domestic cats kill billions of birds annually and are a major source of bird mortality. Keeping cats indoors protects both birds and cats.
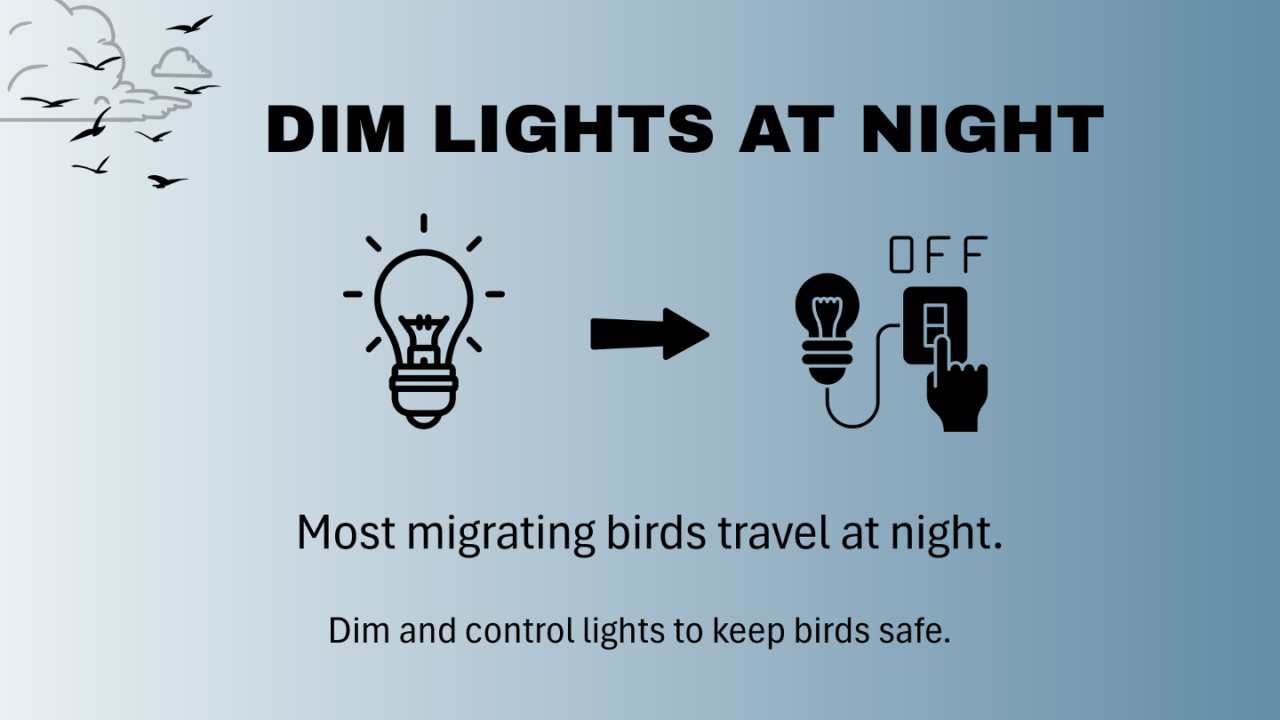
For fall migration, also consider turning off nonessential lights from dusk to dawn! Artificial light attracts and disorients birds, drawing them into cities and other built environments where untreated glass creates an additional hazard. Eliminate light when and where it is unnecessary, whether in a kitchen, greenhouse, library, or skyscraper. BirdCast’s full migration periods are March 1-June 15 and August 15-November 30, so turning lights out during these windows – and especially on high-migration nights – can make a tremendous difference for nocturnally migrating birds while saving energy and money.

Next Season
Fall migration season is officially upon us! You can now find BirdCast forecasts and dashboards once again active until November 15th. Good luck to everyone heading out to go birding, and have a great rest of your summer!
Shawn Wallace thanks Adriaan Dokter, Hermione Deng, and Andrew Farnsworth for their assistance with the production of the video and the article. Another thank you to https://earth.nullschool.net/ for allowing us to use their interactive wind and temperature maps seen in this article and in the Youtube video.
Scientific Team
BirdCast is made possible by the participating scientists at the below institutions, and many other contributors.